Attempting to Define True Unemployment Numbers

The Bureau of Labor Statistics (BLS) and a number of economists’ websites have presented the U.S. unemployment numbers in different forms, using different parameters, overpowering people with different interpretations, and confusing the issue.
Attempting to Define True Unemployment Numbers
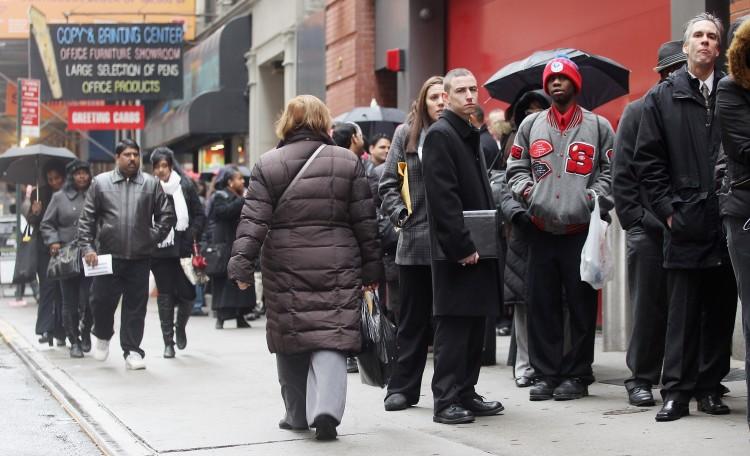
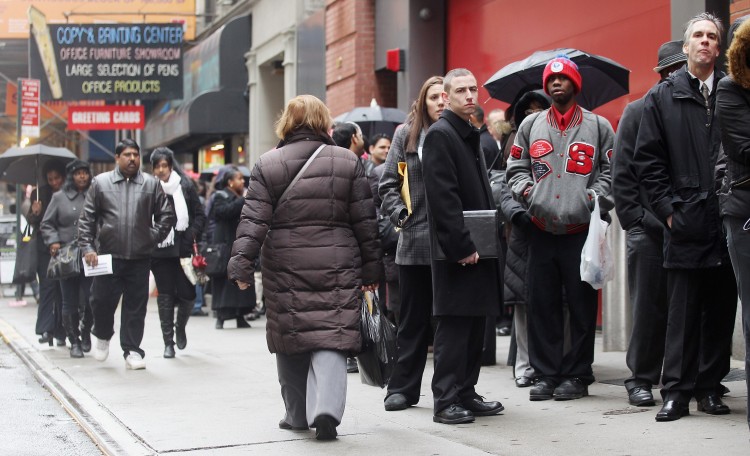
Job seekers line up to attend a job fair in Manhattan on Jan. 26. Experts suggest that corporations and the government need to create jobs that provide income for the unemployed. (Mario Tama/Getty Images)
2/1/2012
Updated:
10/1/2015
<a><img class="size-large wp-image-1792484" src="https://www.theepochtimes.com/assets/uploads/2015/09/137772974_Unemployment.jpg" alt="" width="590" height="359"/></a>

From time immemorial, statistical information could be used to represent a certain viewpoint by including or excluding certain factors or parameters. Therefore, the interpretation of publicized numbers could lead to the support or rejection of a project, analysis, plan, mission, or undertaking.

“Numbers can seem very concrete, and some are misled by numbers simply because they seem to be fact and have an indisputable value. Thus statistical data can often be used in a misleading fashion to wow people with numbers, and make things in dispute seem more like fact,” according to the article “Can Statistics be Misleading?” on the wiseGEEK website.

The Bureau of Labor Statistics (BLS) and a number of economists’ websites have presented the U.S. unemployment numbers in different forms, using different parameters, overpowering people with different interpretations, and confusing the issue.

The latest BLS seasonally adjusted unemployment numbers, reported on Jan. 24, suggest an improved employment environment, with the unemployment rate having decreased to 8.5 percent in December 2011, a decrease of .9 percent over December 2010, and a .2 decrease over November 2011.

The U.S. states contributing to continued high unemployment are Nevada, with a rate of 12.6 percent, California with 11.1 percent, Rhode Island with 10.8 percent, and the District of Columbia and Mississippi with 10.4 percent.

The lowest U.S. unemployment rates were reported in North Dakota (3.3 percent), Nebraska (4.1 percent), South Dakota (4.2 percent), New Hampshire (5.1 percent), and Vermont (5.1 percent).

“Regional and state unemployment rates were slightly lower in December. Thirty-seven states and the District of Columbia recorded unemployment rate decreases, 3 states posted rate increases, and 10 states had no rate change,” according to the BLS release.

Taking the Numbers and Viewing Them Differently

“First, we challenge the notion that the BLS should be the standard bearer for job growth in the U.S. because its estimates are frequently revised, ranging from a few percent to several hundred percent. ... Second, the BLS and the ADP [employer services company] estimates are based on surveys that are incomplete when released,” said Madeline Schnapp, director at Trim Tabs Investment Research, on Jan. 5 on Mish’s Global Economic Trend Analysis website.

Seasonally adjusted BLS numbers indicate that the U.S. civilian population increased by 1.7 million in 2011 compared to 2010, while the labor force increased by 324,000 for the year, but decreased by 50,000 between November 2011 and December 2011. According to the same statistics, unemployment numbers increased by 1.3 million from the end of 2010 to the end of 2011.

ADP reports that seasonally adjusted private sector employment rose by 325,000 during December 2011, calling it “the largest monthly gain since last December 2010 and nearly twice the average monthly gain since May when employment decelerated sharply.”

Schnapp suggests that the BLS numbers are skewed, especially during holiday seasons, as seasonal jobs are eliminated after the holiday season ends. She said that Trim Tabs uses tax withholdings to derive an estimate of the U.S. unemployment numbers.

Mike Shedlock, investment advisor for Sitka Pacific Capital Management, believes that the numbers reported by the BLS are not realistic as they exclude those who are no longer seriously looking for a job and points to the 50,000 November/December 2011 decrease in labor force numbers.

“After two months of increases [September 2011 and October 2011], once again the labor force fell. This is not a good sign. Moreover, were it not for people dropping out of the labor force for the past two years, the unemployment rate would be well over 11%,” said Shedlock in his labor force analysis on Mish’s website.

The BLS employs two different surveys for its analysis of the unemployed, which are conducted by the U.S. Census Bureau and/or the BLS, according to the Portal Seven website. One of the two surveys is the Current Population Survey (CPS).

The CPS numbers allow unemployment numbers to be calculated by using different parameters, and then they are reported in tables labeled U-1 through U-6.

For example, the U-1 table reports individuals who have been out of work for more than three months. U-2 includes those who were laid off or fired. U-5 is used for the official unemployment rate as reported by the BLS and includes those actively looking for a job. From U-4 to U-6, other data is included, with each drawing on information such as discouraged workers and part-time workers.

If one uses the U-6 table to report unemployment numbers, the December 2011 unemployment rate would be 15.2 percent versus 16.6 percent in December 2010. U-1 reports the lowest unemployment rate of 5.0 percent versus 5.6 percent in December 2010. The U-2 table’s latest number is 4.9 percent and was reported in August 2011. U-3 provides the official unemployment rate of 8.5 percent, while U-4 reports a December 2011 figure of 9.1 percent, and U-5 reports 10 percent.

“The ‘U-6’ is considered to be a broader measure of the unemployment situation in the United States,” according to an entry on the Dave Manuel website.

Next...Laying Blame For the Unemployment Crisis

Laying Blame For the Unemployment Crisis

“None of the unemployed or under-employed workers had any role whatsoever in creating the financial crisis and the ensuing recession. They are all casualties of other persons’ errors, actions, inactions and greed. Whether you think the financial industry or the government played the key role is irrelevant. The unemployed did not,” according to a December 2011 article on the University of Delaware website.

A number of scholarly articles suggest that the unemployment crisis will continue until the economy picks up. These experts suggest that corporations and the U.S. government need to create jobs that provide income for the unemployed. Income would increase the purchasing power of the individual, allowing people to buy products and stimulate the economy.

Unceasing Layoffs

The U.S. government, once thought to be immune to layoffs and job cuts, can no longer be called the place with the least layoffs.

“The increase in job cuts in 2011 was due primarily to heavy job cutting in the government sector. ... Government job cuts were 188 percent higher than the second-ranked financial sector, which saw 63,624 job cuts this year,” according to a Jan. 5 press release by the outplacement company Challenger, Gray & Christmas.

Federal and local government layoffs will continue, with the U.S. Postal Service eliminating about 260,000 positions in 2012, according to the dailyjobcuts website. The Philadelphia Schools will lay off 1,400 employees.

“Washington is under immense pressure to cut spending and it looks like every deal to extend tax cuts, raise the debt ceiling and pass the budget will come with measures to cut spending, which can be expected to result in more job cuts,” Challenger, Gray & Christmas predicted.