San Francisco: Second Worst Travel Delays in the Nation

San Francisco–Oakland ties for second with Los Angeles, for requiring the most extra time to ensure arriving at on time .
San Francisco: Second Worst Travel Delays in the Nation
Catherine Yang
2/14/2013
Updated:
10/1/2015
<a><img class="size-large wp-image-1770558" title="Traffic backs up on westbound Interstate 80 as safety cones block the entrance to the the San Francisco Bay Bridge in Emeryville, California, on Oct. 28, 2009. According to a recent report, San Francisco-Oakland is in one of the three most congested metropolitan areas in the country. (Justin Sullivan/Getty Images)" src="https://www.theepochtimes.com/assets/uploads/2015/09/92427750.jpg" alt="Traffic backs up on westbound Interstate 80 as safety cones block the entrance to the the San Francisco Bay Bridge in Emeryville, California, on Oct. 28, 2009. According to a recent report, San Francisco-Oakland is in one of the three most congested metropolitan areas in the country. (Justin Sullivan/Getty Images)" width="590" height="367"/></a>
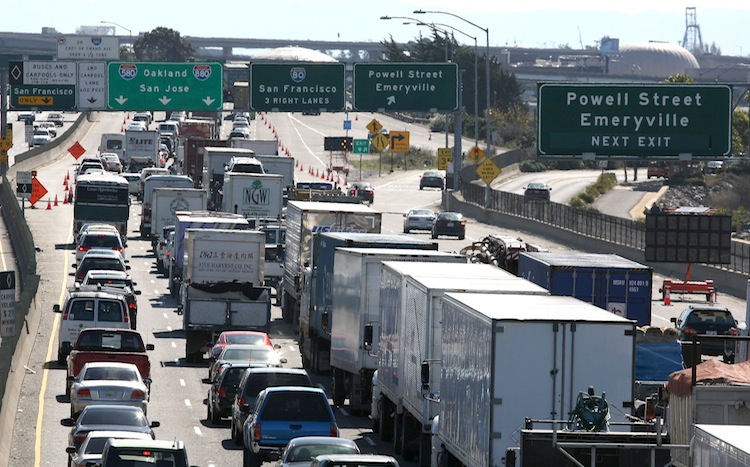
Traffic backs up on westbound Interstate 80 as safety cones block the entrance to the the San Francisco Bay Bridge in Emeryville, California, on Oct. 28, 2009. According to a recent report, San Francisco-Oakland is in one of the three most congested metropolitan areas in the country. (Justin Sullivan/Getty Images)

SAN FRANCISCO—For a city that prides itself for “walkability,” San Francisco is in one of the three most congested metropolitan areas in the country.

San Francisco–Oakland ties for second with Los Angeles, for requiring the most extra time to ensure arriving at on time.

Depending on the city, travelers may have to allow themselves three hours to make a 30-minute trip as overall travel reliability has gone down, according to the 2012 Urban Mobility Report released by Texas A&M Transportation Institute (TTI).

Planning Time Index (PTI) is the extra time needed to be punctual for urgent events like scheduled appointments. For example, a traveler would allow 60 minutes for a trip that typically takes 20 minutes if the PTI is 3.00.

“As bad as traffic jams are, it’s even more frustrating that you can’t depend on traffic jams being consistent from day-to-day,” said Bill Eisele, a TTI researcher and report co-author. 

Over the past five years, travel time, congestion, and cost of congestion have all increased. Cost of congestion is the extra value of travel time as measured by TTI in fuel consumption by vehicles travelling at a slower speed. In 2011, congestion cost the city upward of 3.2 billion, ranking eighth in the nation--which is about a third of the cost of Los Angeles.

The total hours spent in traffic for San Francisco–Oakland was 155 million hours, compared to the 501 million hours last year in Los Angeles. The differences in the type of traffic between the two areas are partially due to public transportation usage despite the same PTI. According to a 2010 American Community Survey, San Francisco ranked 4th at 34 percent of residents using public transportation while Los Angeles ranked 31st at 11 percent ridership. 

The report showed that various aspects of congestion have stayed at about the same level from the year before, because “congestion solutions are not being pursued aggressively enough.”

However, not all congestion is bad, says Randy Rentschler from the Metropolitan Transportation Commission (MTC). “It’s often a good thing. Congestion is a sign of a healthy economy.”

Wait times aside, the carbon dioxide (CO2) emission rankings were probably a bigger surprise. The report also looked at excess CO2 emissions due to congestion, and San Francisco–Oakland ranked 10th with 1.3 billion pounds of “congested CO2” in 2011. However, the rankings only look at emissions produced during congestion wait times.

Transportation is the biggest contributor of greenhouse gas emissions in the Bay Area according to MTC reports, with industrial and commercial sources (without electricity generation) at a close level. 

San Francisco has been listed as the greenest city in a 2011 study looking at the 27 most populated cities in the United States and Canada conducted by Siemens. 

The city has put forth many initiatives to reduce greenhouse gas emissions, and the Department of Public Works (DPW) Strategic Plan for 2013–2015 aims to reduce the city’s carbon footprint 25 percent by July 2017 and 80 percent by 2050. On its list of tasks is outreach to promote transportation alternatives for driving to work, which DPW won an award for in 2011. SFMTA has a zero-emission goal set for 2020.

The Epoch Times publishes in 35 countries and in 21 languages. Subscribe to our e-newsletter.