Temperature records used by climate scientists and governments to build models that then forecast dangerous manmade global warming repercussions have serious problems and even corruption in the data, multiple scientists who have published recent studies on the issue told The Epoch Times.
The U.N. Intergovernmental Panel on Climate Change (IPCC) holds the same view, and its leaders are pushing major global policy changes in response.
But scientific experts from around the world in a variety of fields are pushing back. In peer-reviewed studies, they cite a wide range of flaws with the global temperature data used to reach the dire conclusions; they say it’s time to reexamine the whole narrative.
Problems with temperature data include a lack of geographically and historically representative data, contamination of the records by heat from urban areas, and corruption of the data introduced by a process known as “homogenization.”
The flaws are so significant that they make the temperature data—and the models based on it—essentially useless or worse, three independent scientists with the Center for Environmental Research and Earth Sciences (CERES) explained.
The experts said that when data corruption is considered, the alleged “climate crisis” supposedly caused by human activities disappears.
Instead, natural climate variability offers a much better explanation for what is being observed, they said.


Some experts told The Epoch Times that deliberate fraud appeared to be at work, while others suggested more innocent explanations.
But regardless of why the problems exist, the implications of the findings are hard to overstate.
With no climate crisis, the justification for trillions of dollars in government spending and costly changes in public policy to restrict carbon dioxide (CO2) emissions collapses, the scientists explained in a series of interviews about their research.
“For the last 35 years, the words of the IPCC have been taken to be gospel,” according to astrophysicist and CERES founder Willie Soon. Until recently, he was a researcher working with the Center for Astrophysics, Harvard & Smithsonian.
“And indeed, climate activism has become the new religion of the 21st century—heretics are not welcome and not allowed to ask questions,” Mr. Soon told The Epoch Times.

“But good science demands that scientists are encouraged to question the IPCC’s dogma. The supposed purity of the global temperature record is one of the most sacred dogmas of the IPCC.”
The latest U.S. government National Climate Assessment report states: “Human activities are changing the climate.
“The evidence for warming across multiple aspects of the Earth system is incontrovertible, and the science is unequivocal that increases in atmospheric greenhouse gases are driving many observed trends and changes.”
In particular, according to the report, this is because of human activities such as burning fossil fuels for transportation, energy, and agriculture.
Looking at timescales highlights major problems with this narrative, Mr. Soon said.
“When people ask about global warming or climate change, it is essential to ask, ‘Since when?’ The data shows that it has warmed since the 1970s, but that this followed a period of cooling from the 1940s,” he said.
While it is “definitely warmer” now than in the 19th century, Mr. Soon said that temperature proxy data show the 19th century “was exceptionally cold.”
“It was the end of a period that’s known as the Little Ice Age,” he said.
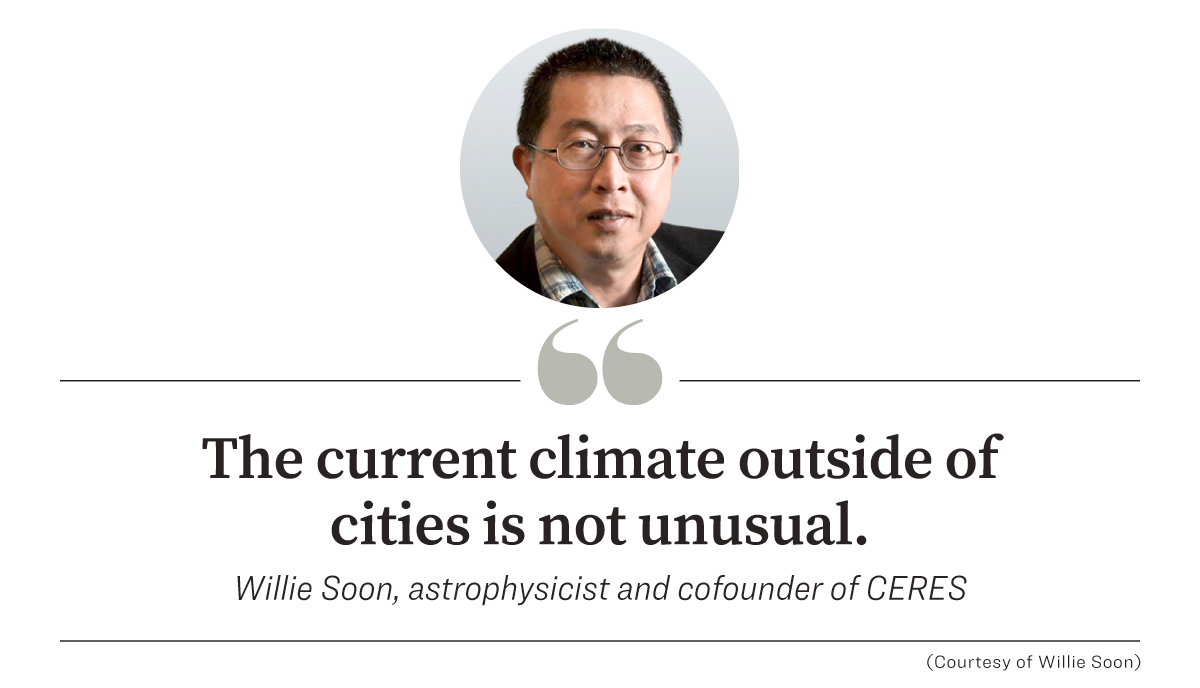
“They show that the current climate outside of cities is not unusual,” he said, adding that heat from urban areas is improperly affecting the data.
“If we exclude the urban temperature data that only represents 3 percent of the planet, then we get a very different picture of the climate.”

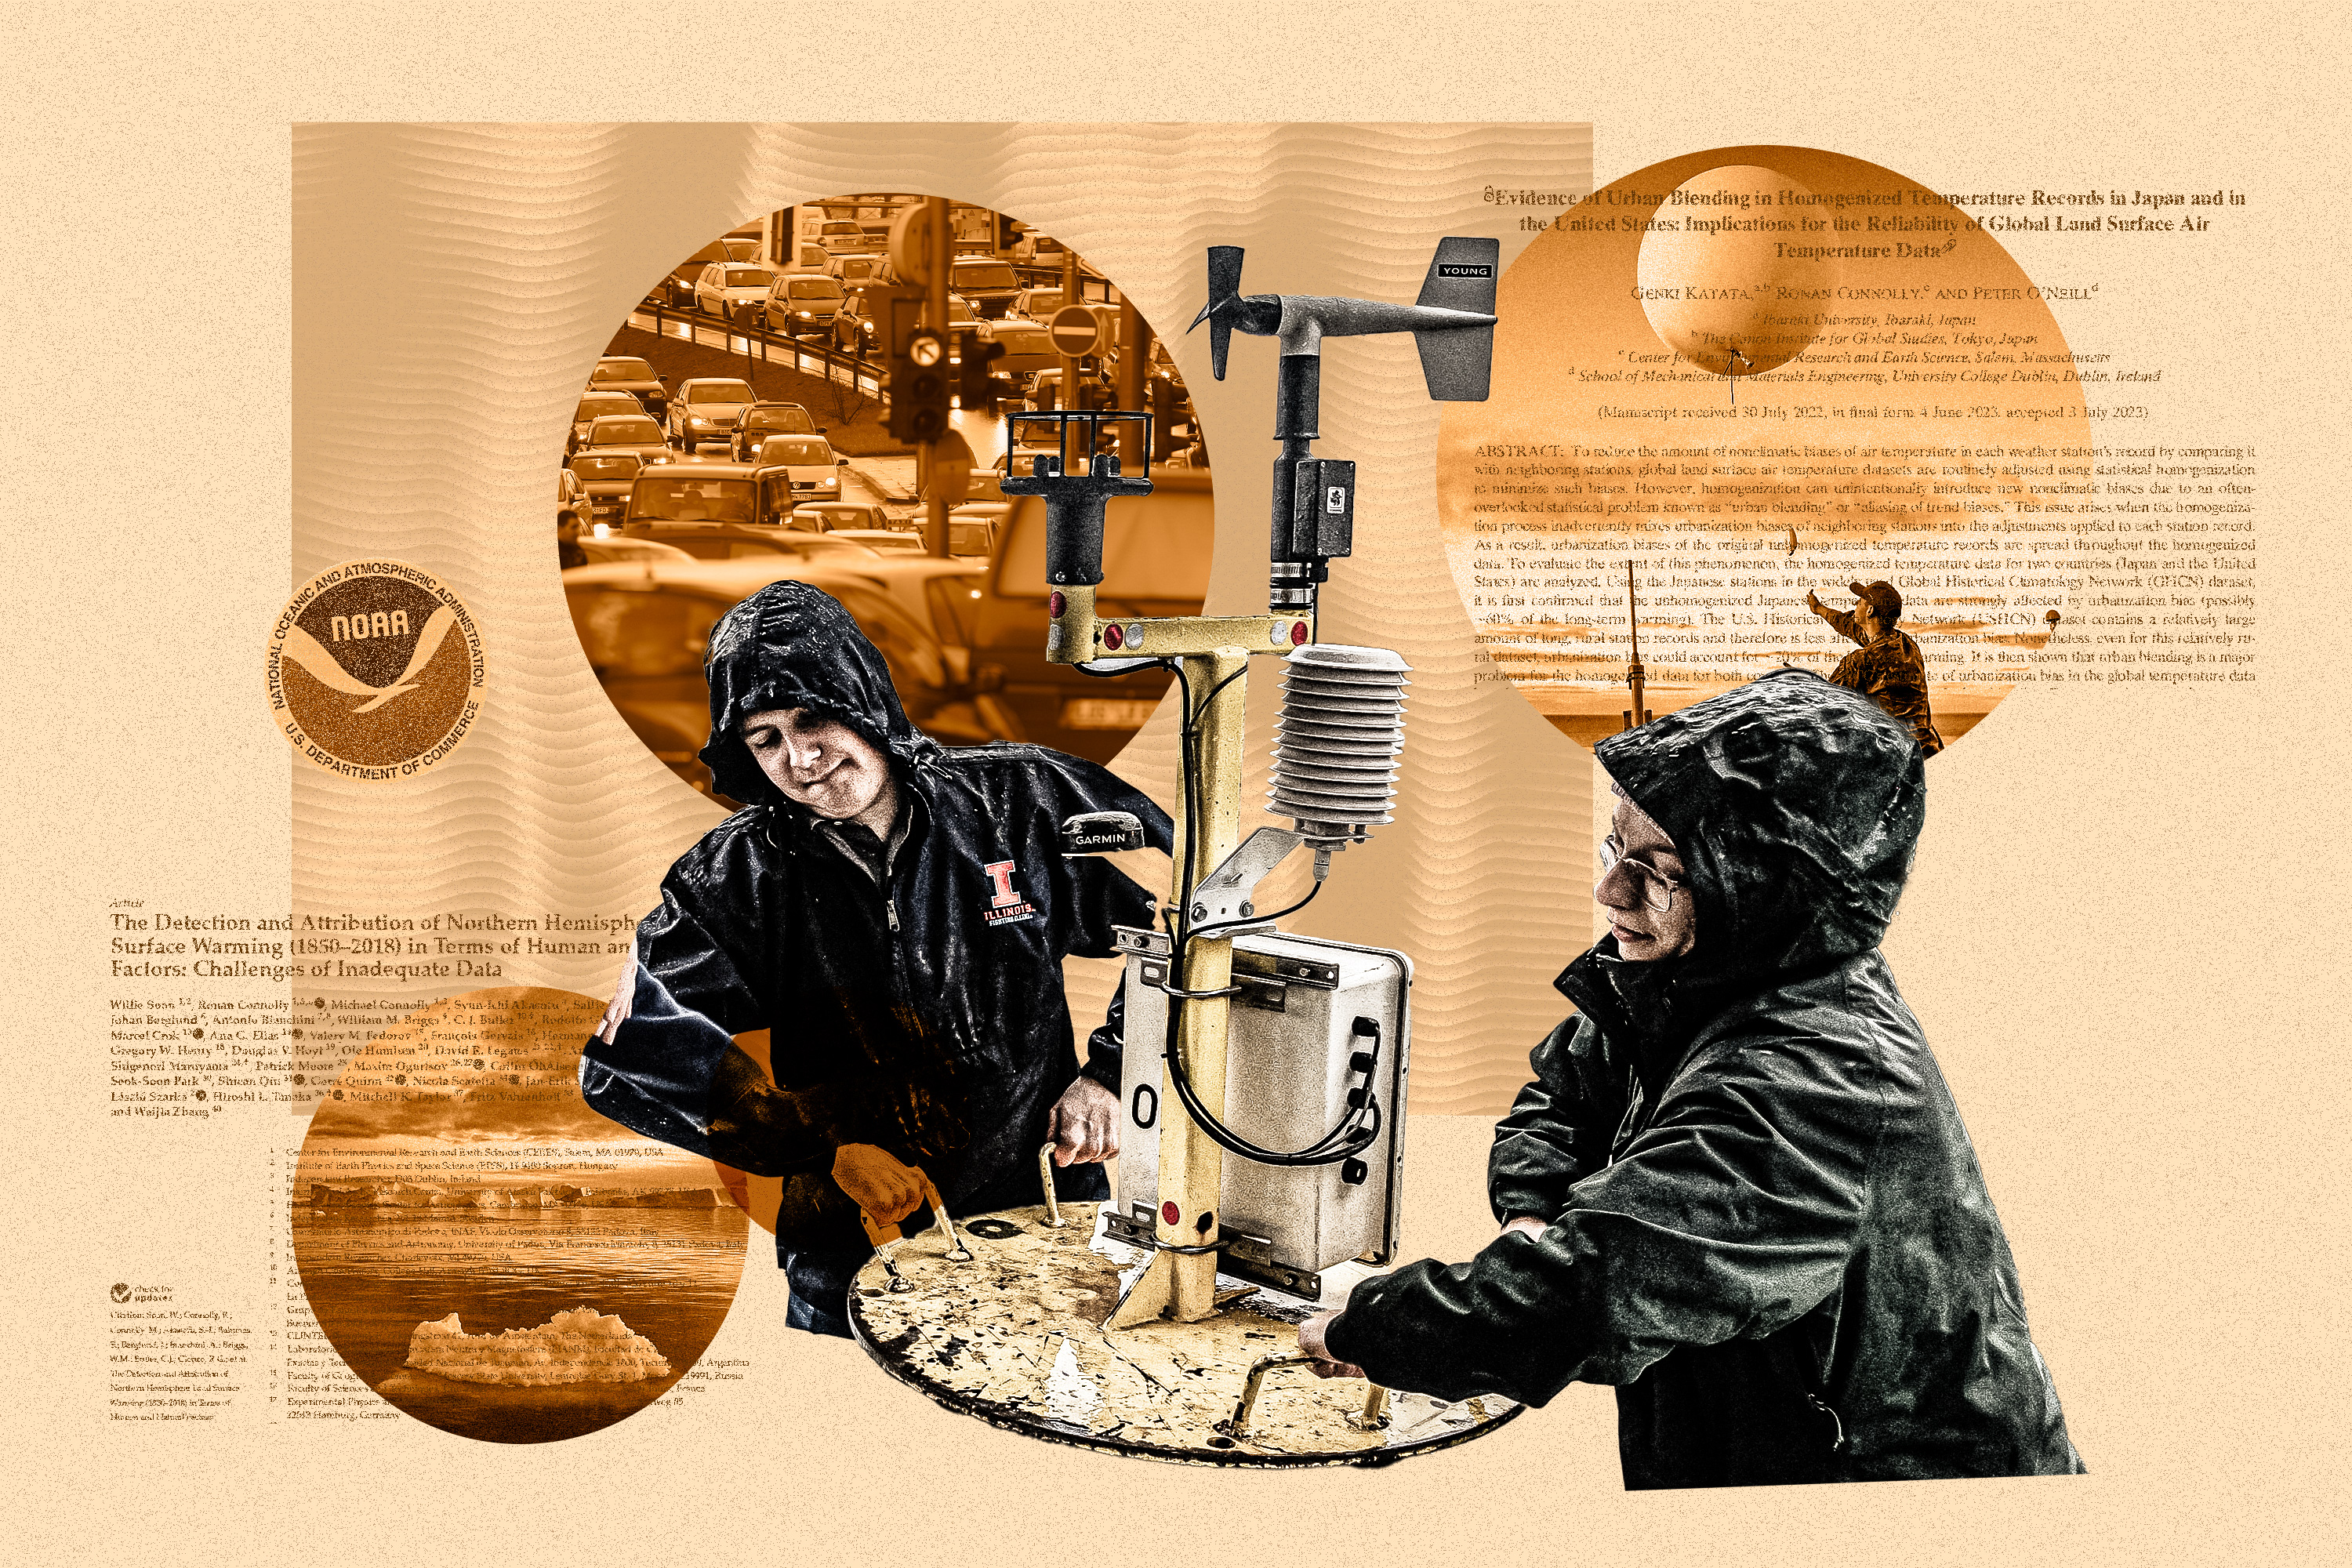
Homogenization
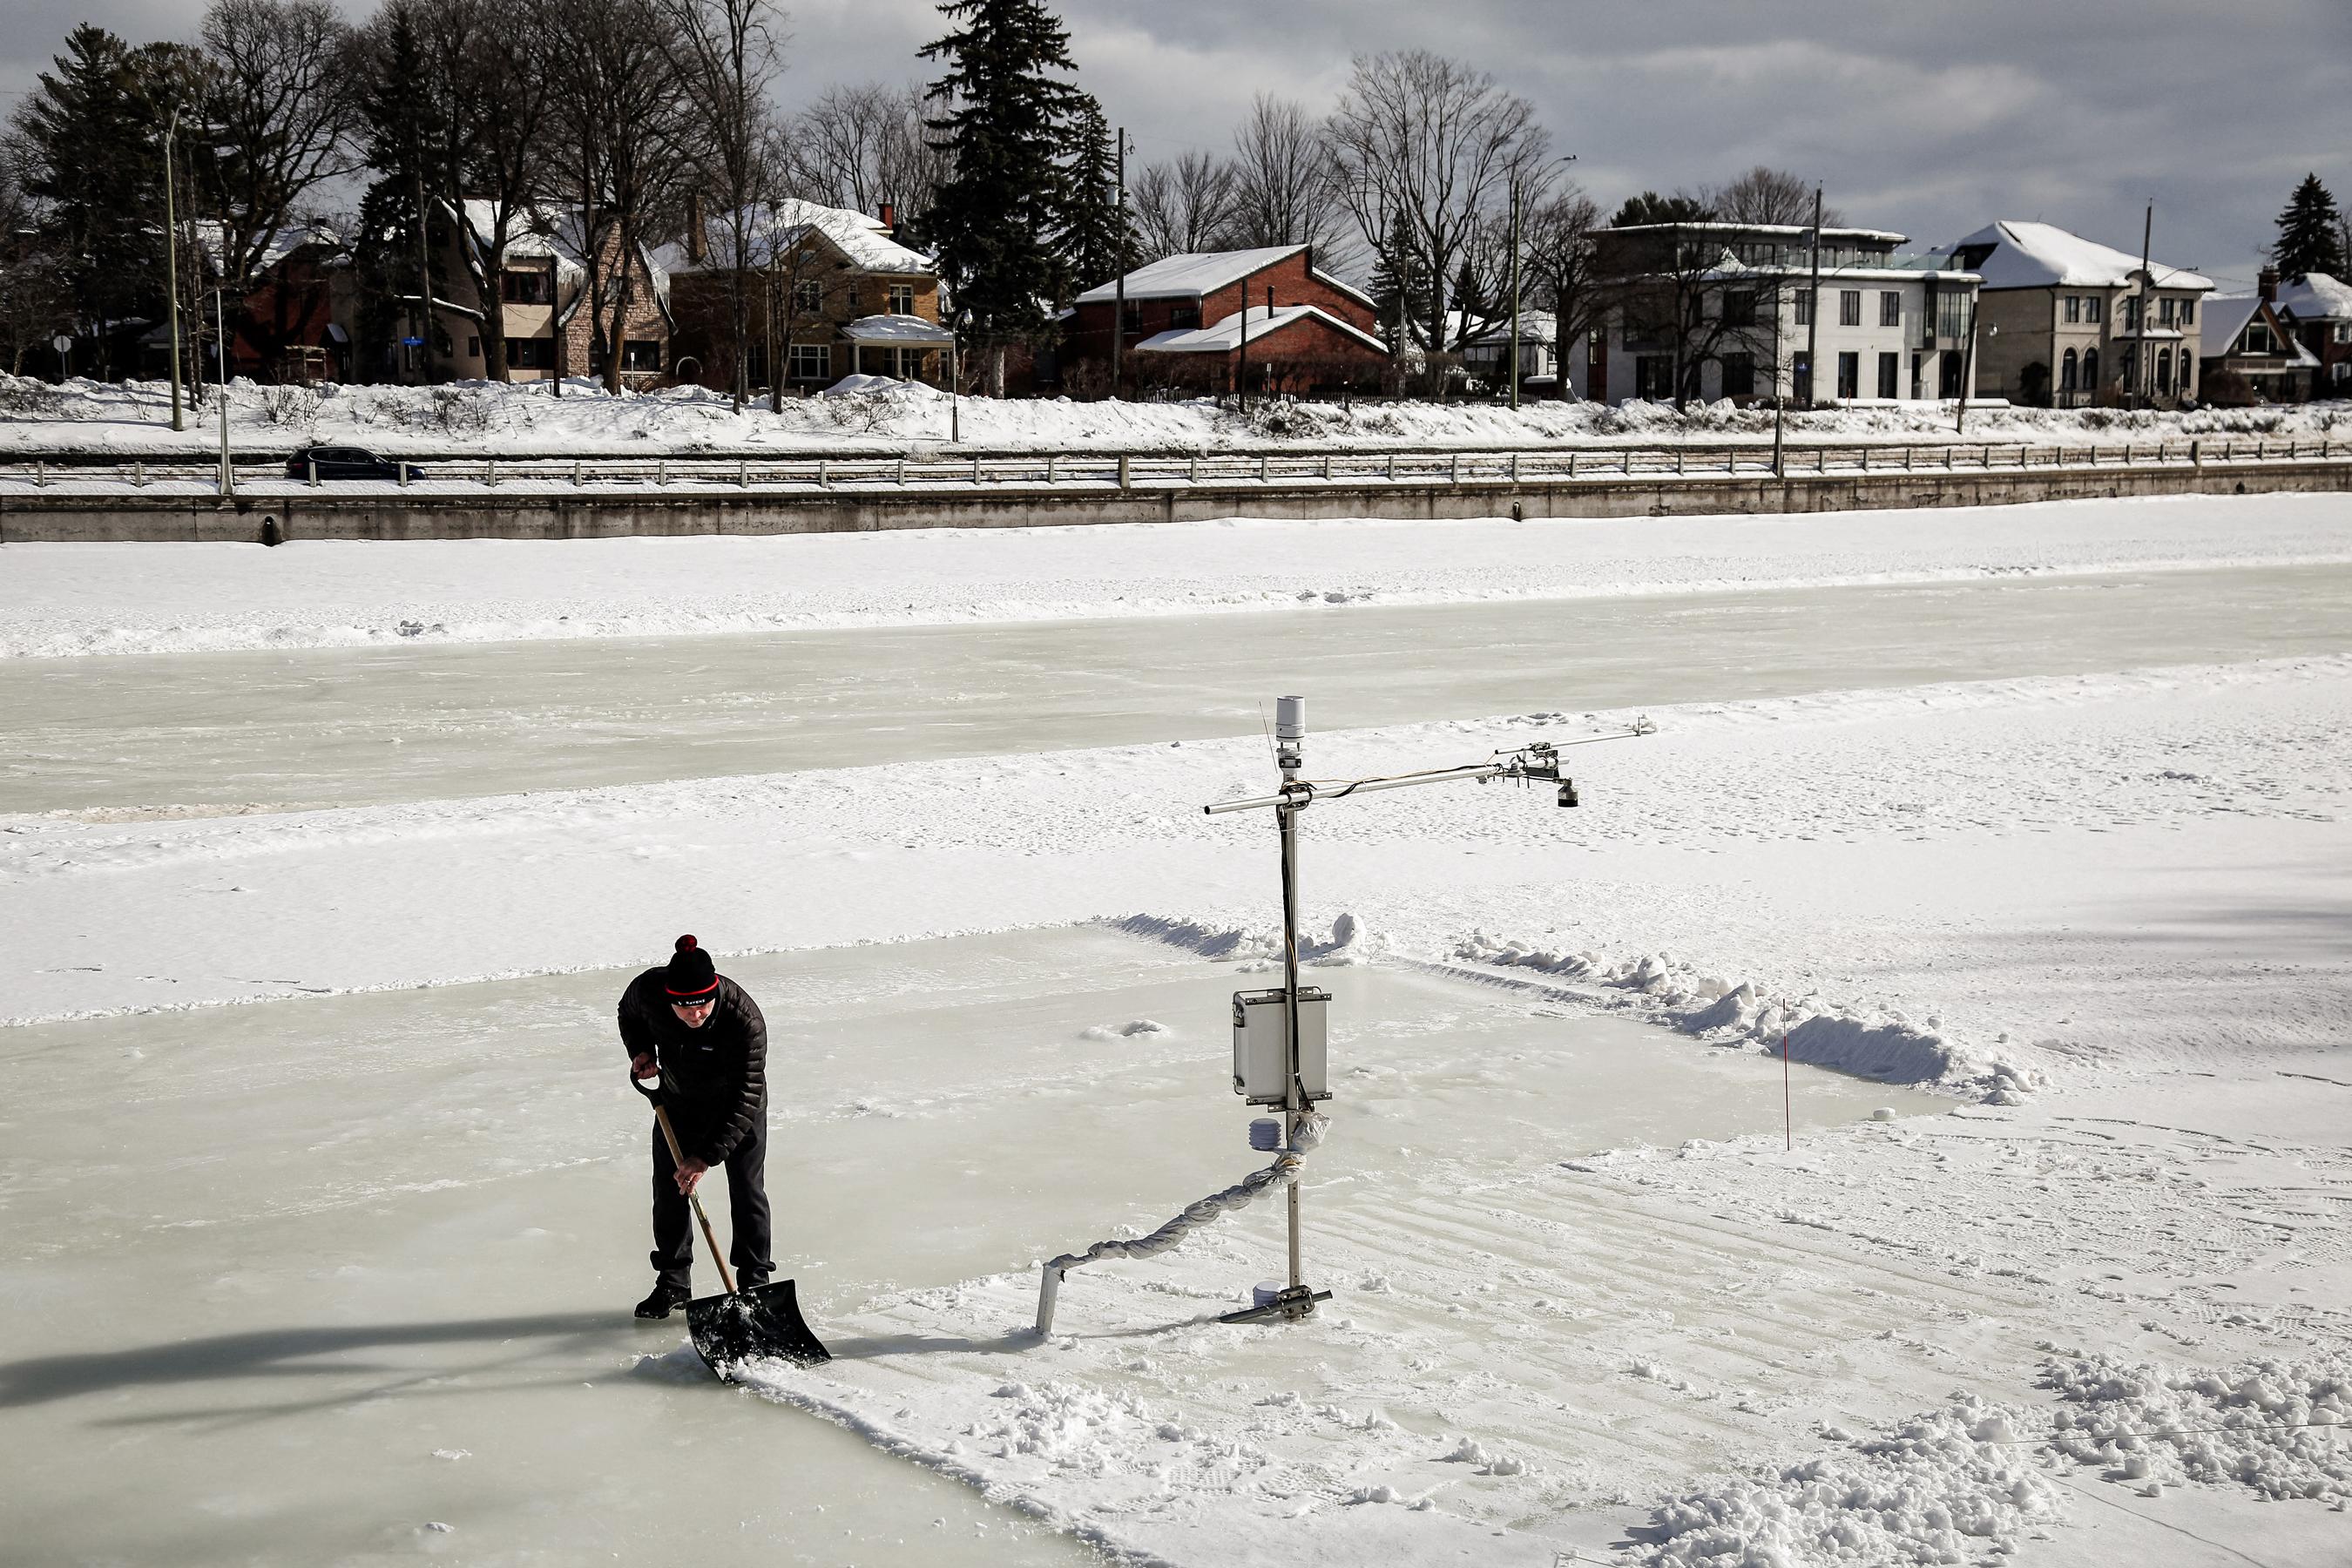
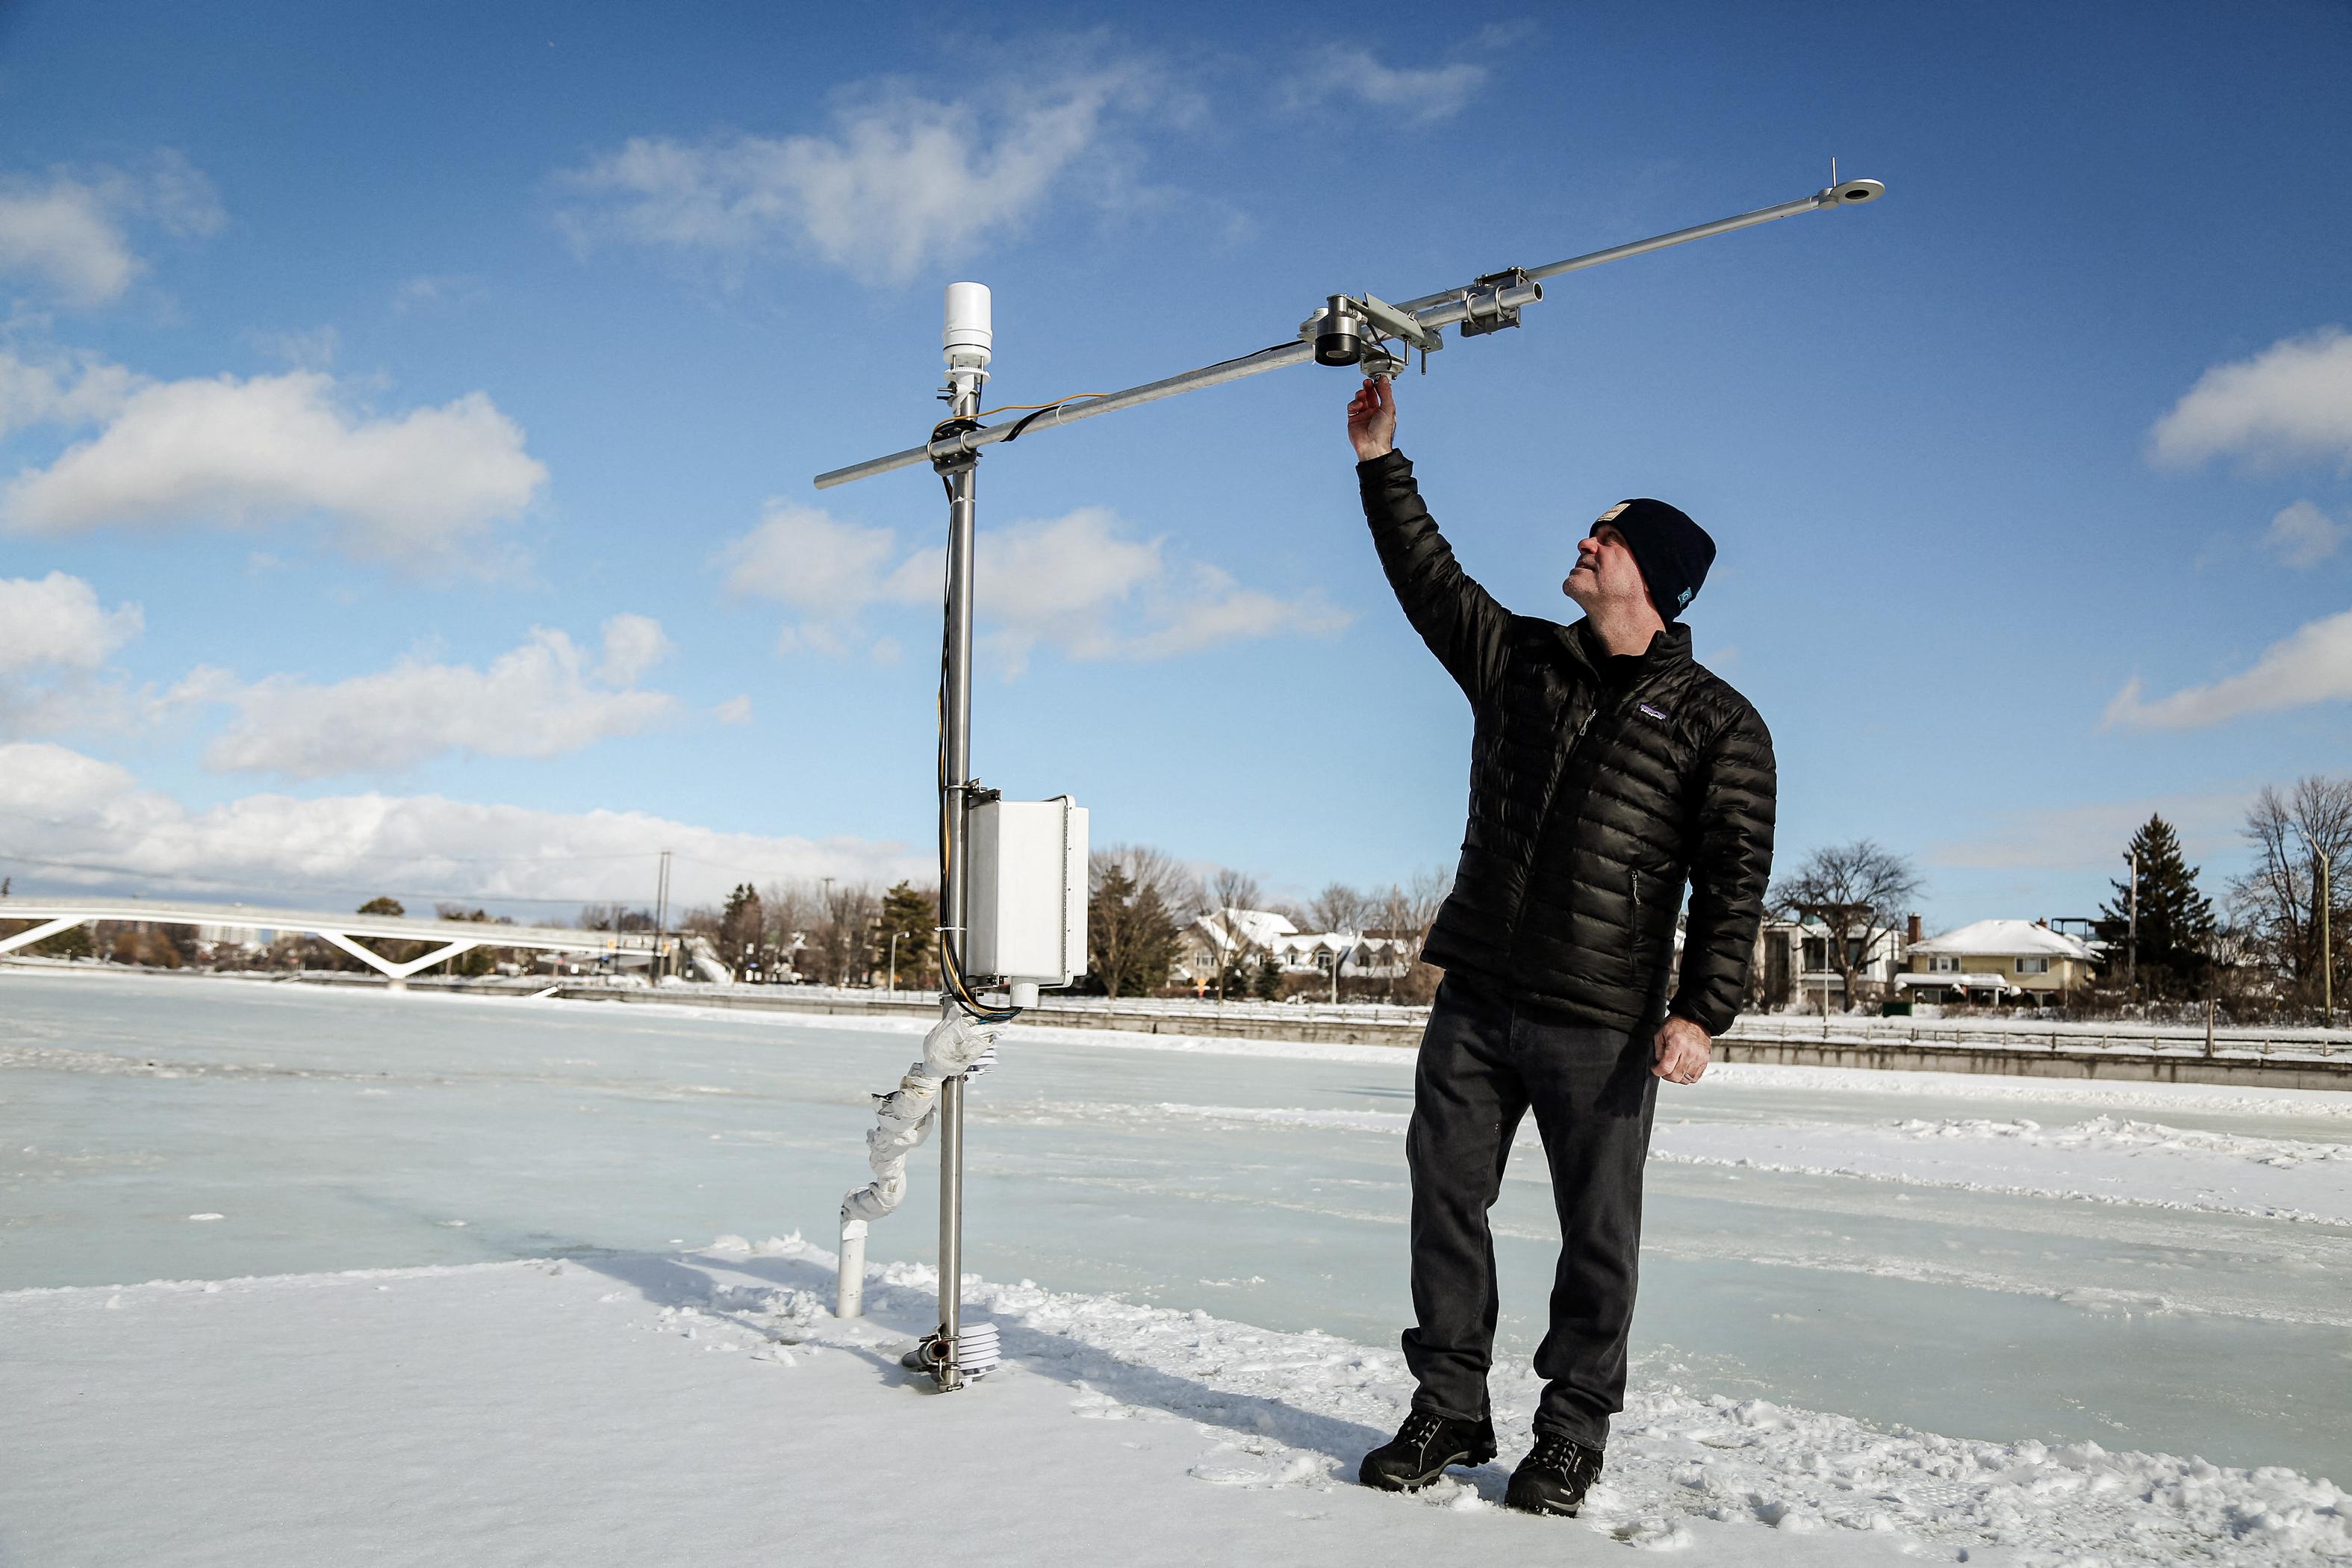
One issue that scientists say is corrupting the data stems from an obscure process known as “homogenization.”According to climate scientists working with governments and the U.N., the algorithms used for homogenization are designed to correct, as much as possible, various biases that might exist in the raw temperature data.
These biases include, among others, the relocation of temperature monitoring stations, changes in technology used to gather the data, or changes in the environment surrounding a thermometer that might impact its readings.
For instance, if a temperature station was originally placed in an empty field but that field has since been paved over to become a parking lot, the record would appear to show much hotter temperatures. As such, it would make sense to try to correct the data collected.
Virtually nobody argues against the need for some homogenization to control for various factors that may contaminate temperature data.
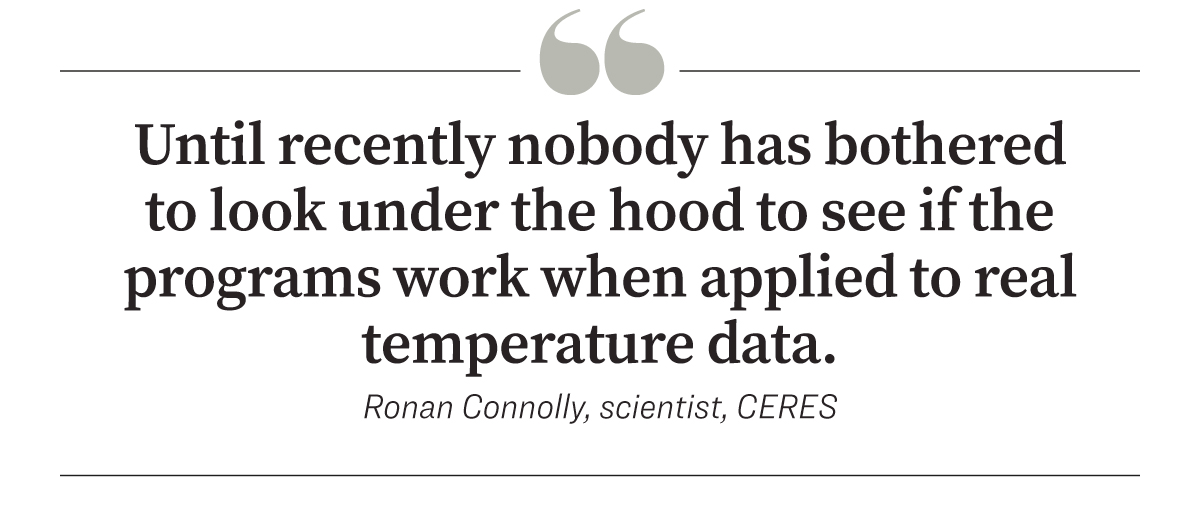
“While the scientific community has become addicted to blindly using these computer programs to fix the data biases, until recently nobody has bothered to look under the hood to see if the programs work when applied to real temperature data,” he told The Epoch Times.
Since the early 2000s, various governmental and intergovernmental organizations creating global temperature records have relied on computer programs to automatically adjust the data.
Mr. Soon, Mr. Connolly, and a team of scientists around the world spent years looking at the programs to determine how they worked and whether they were reliable.
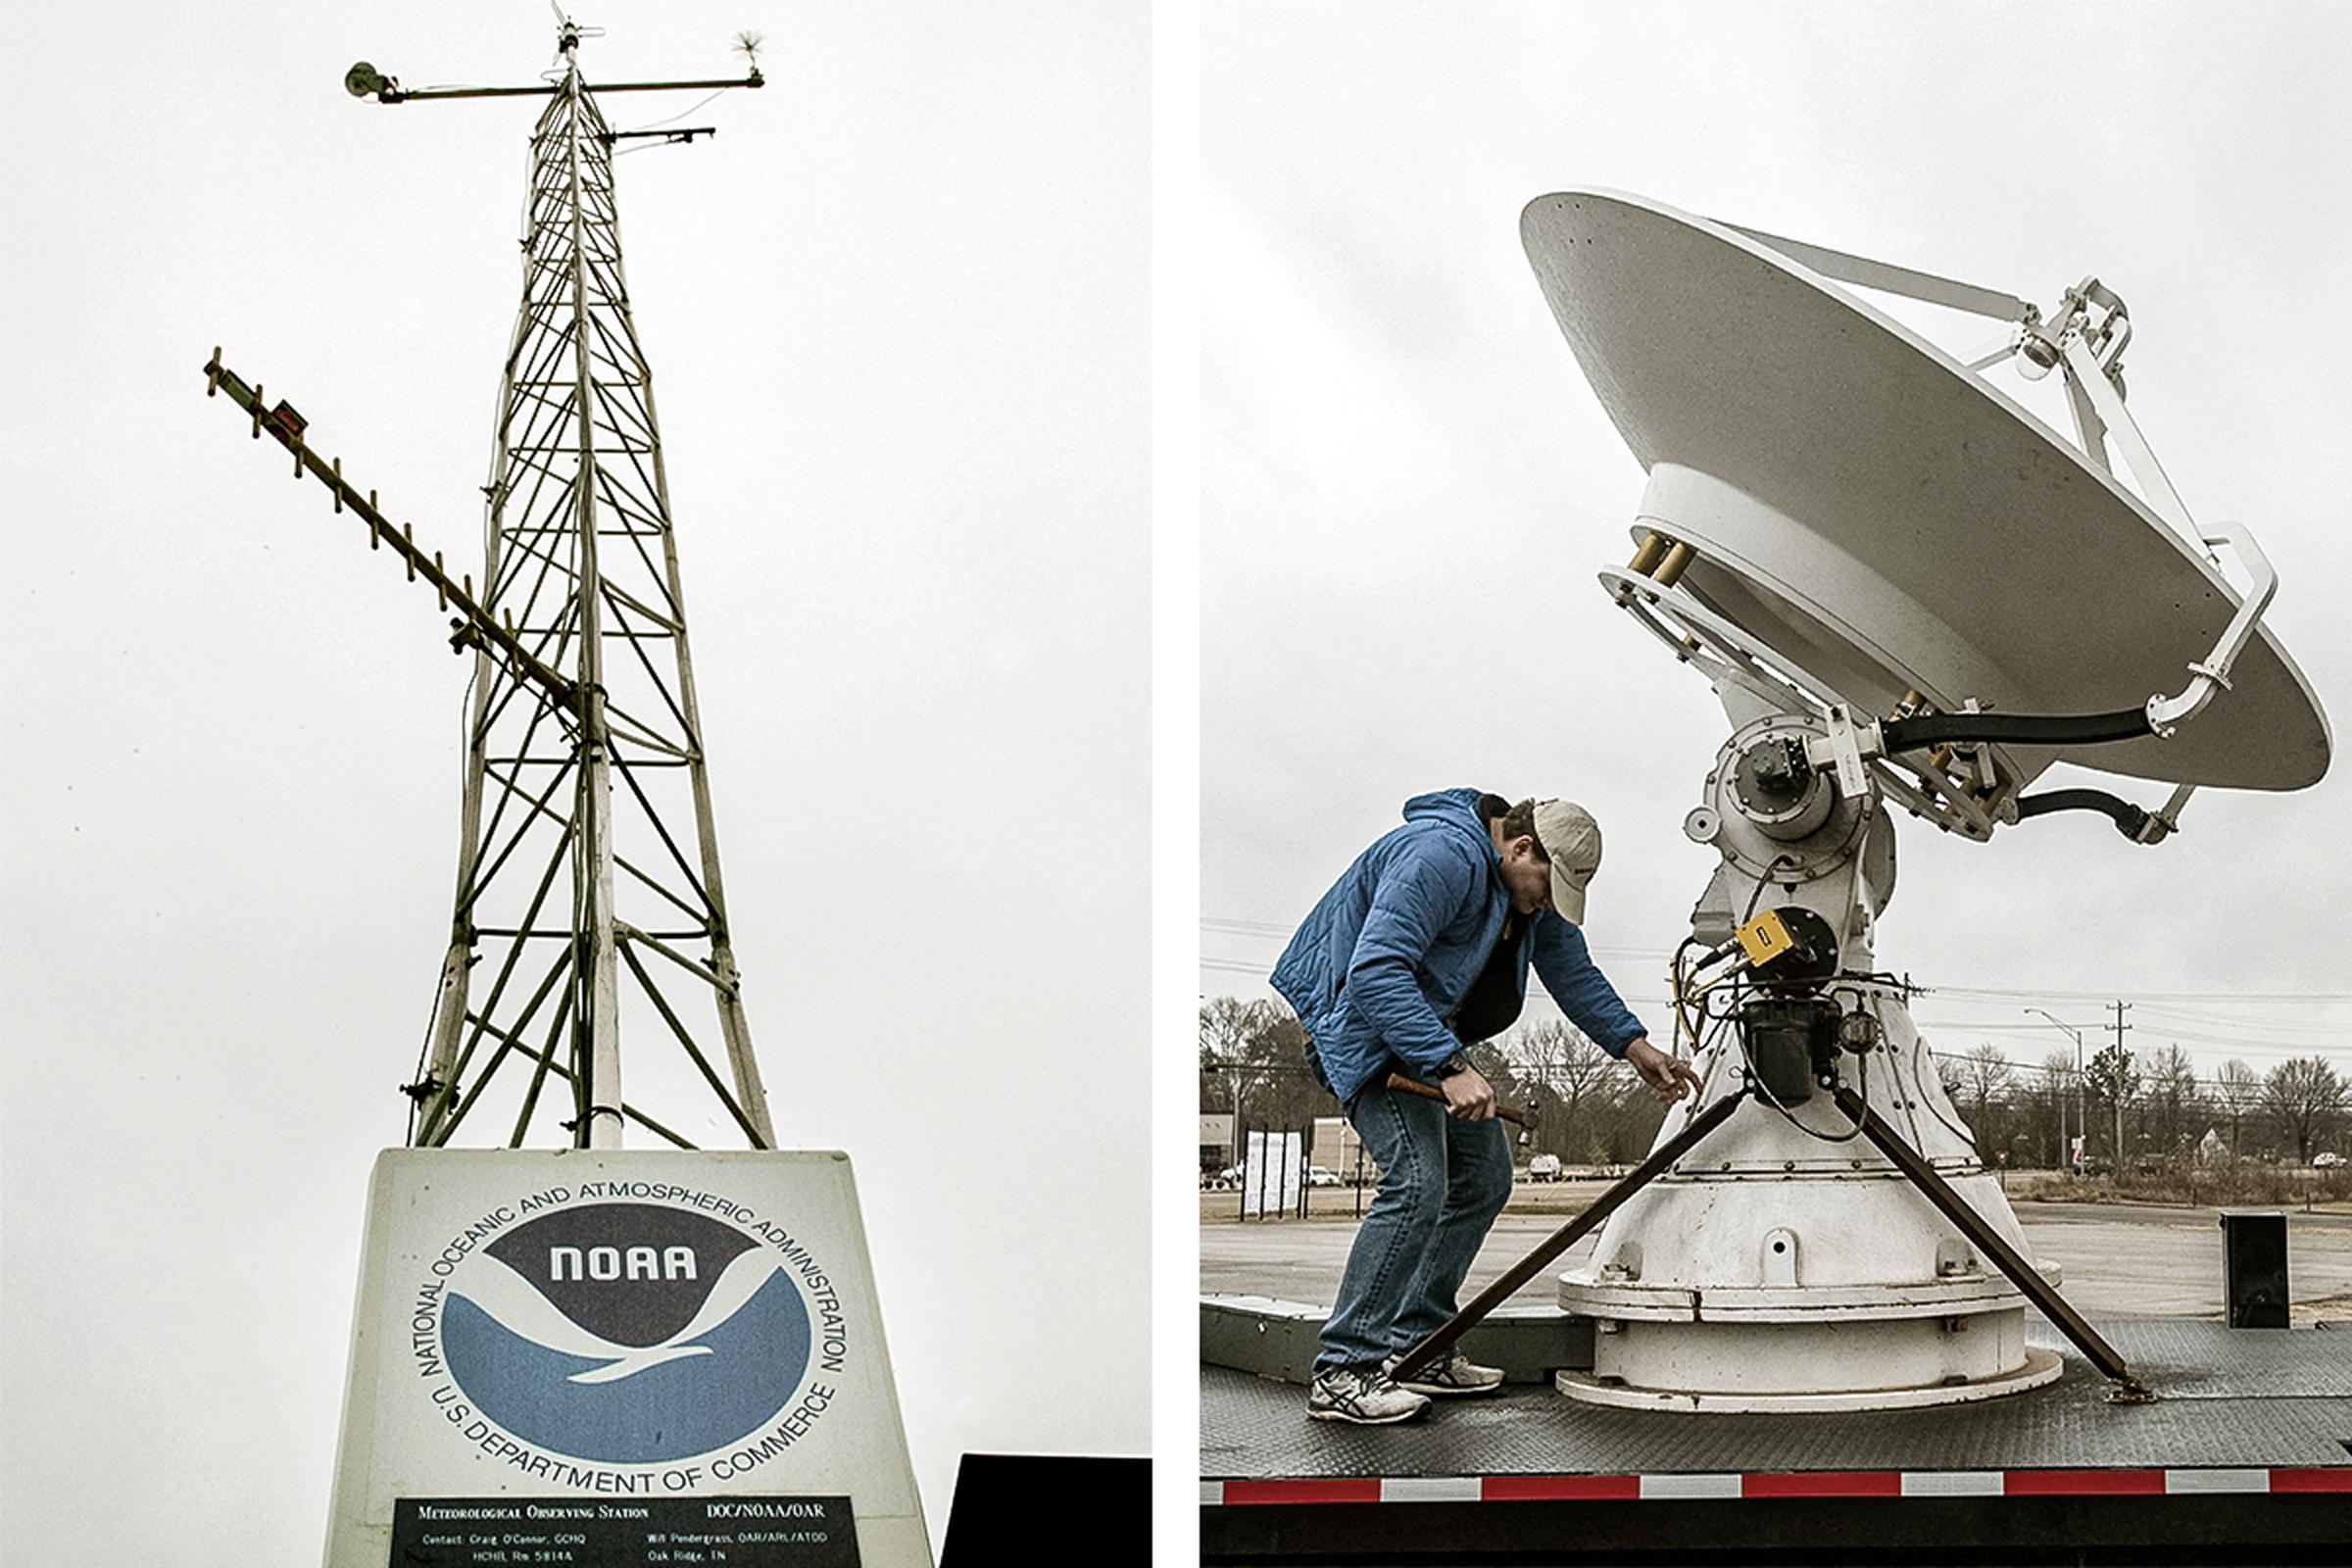
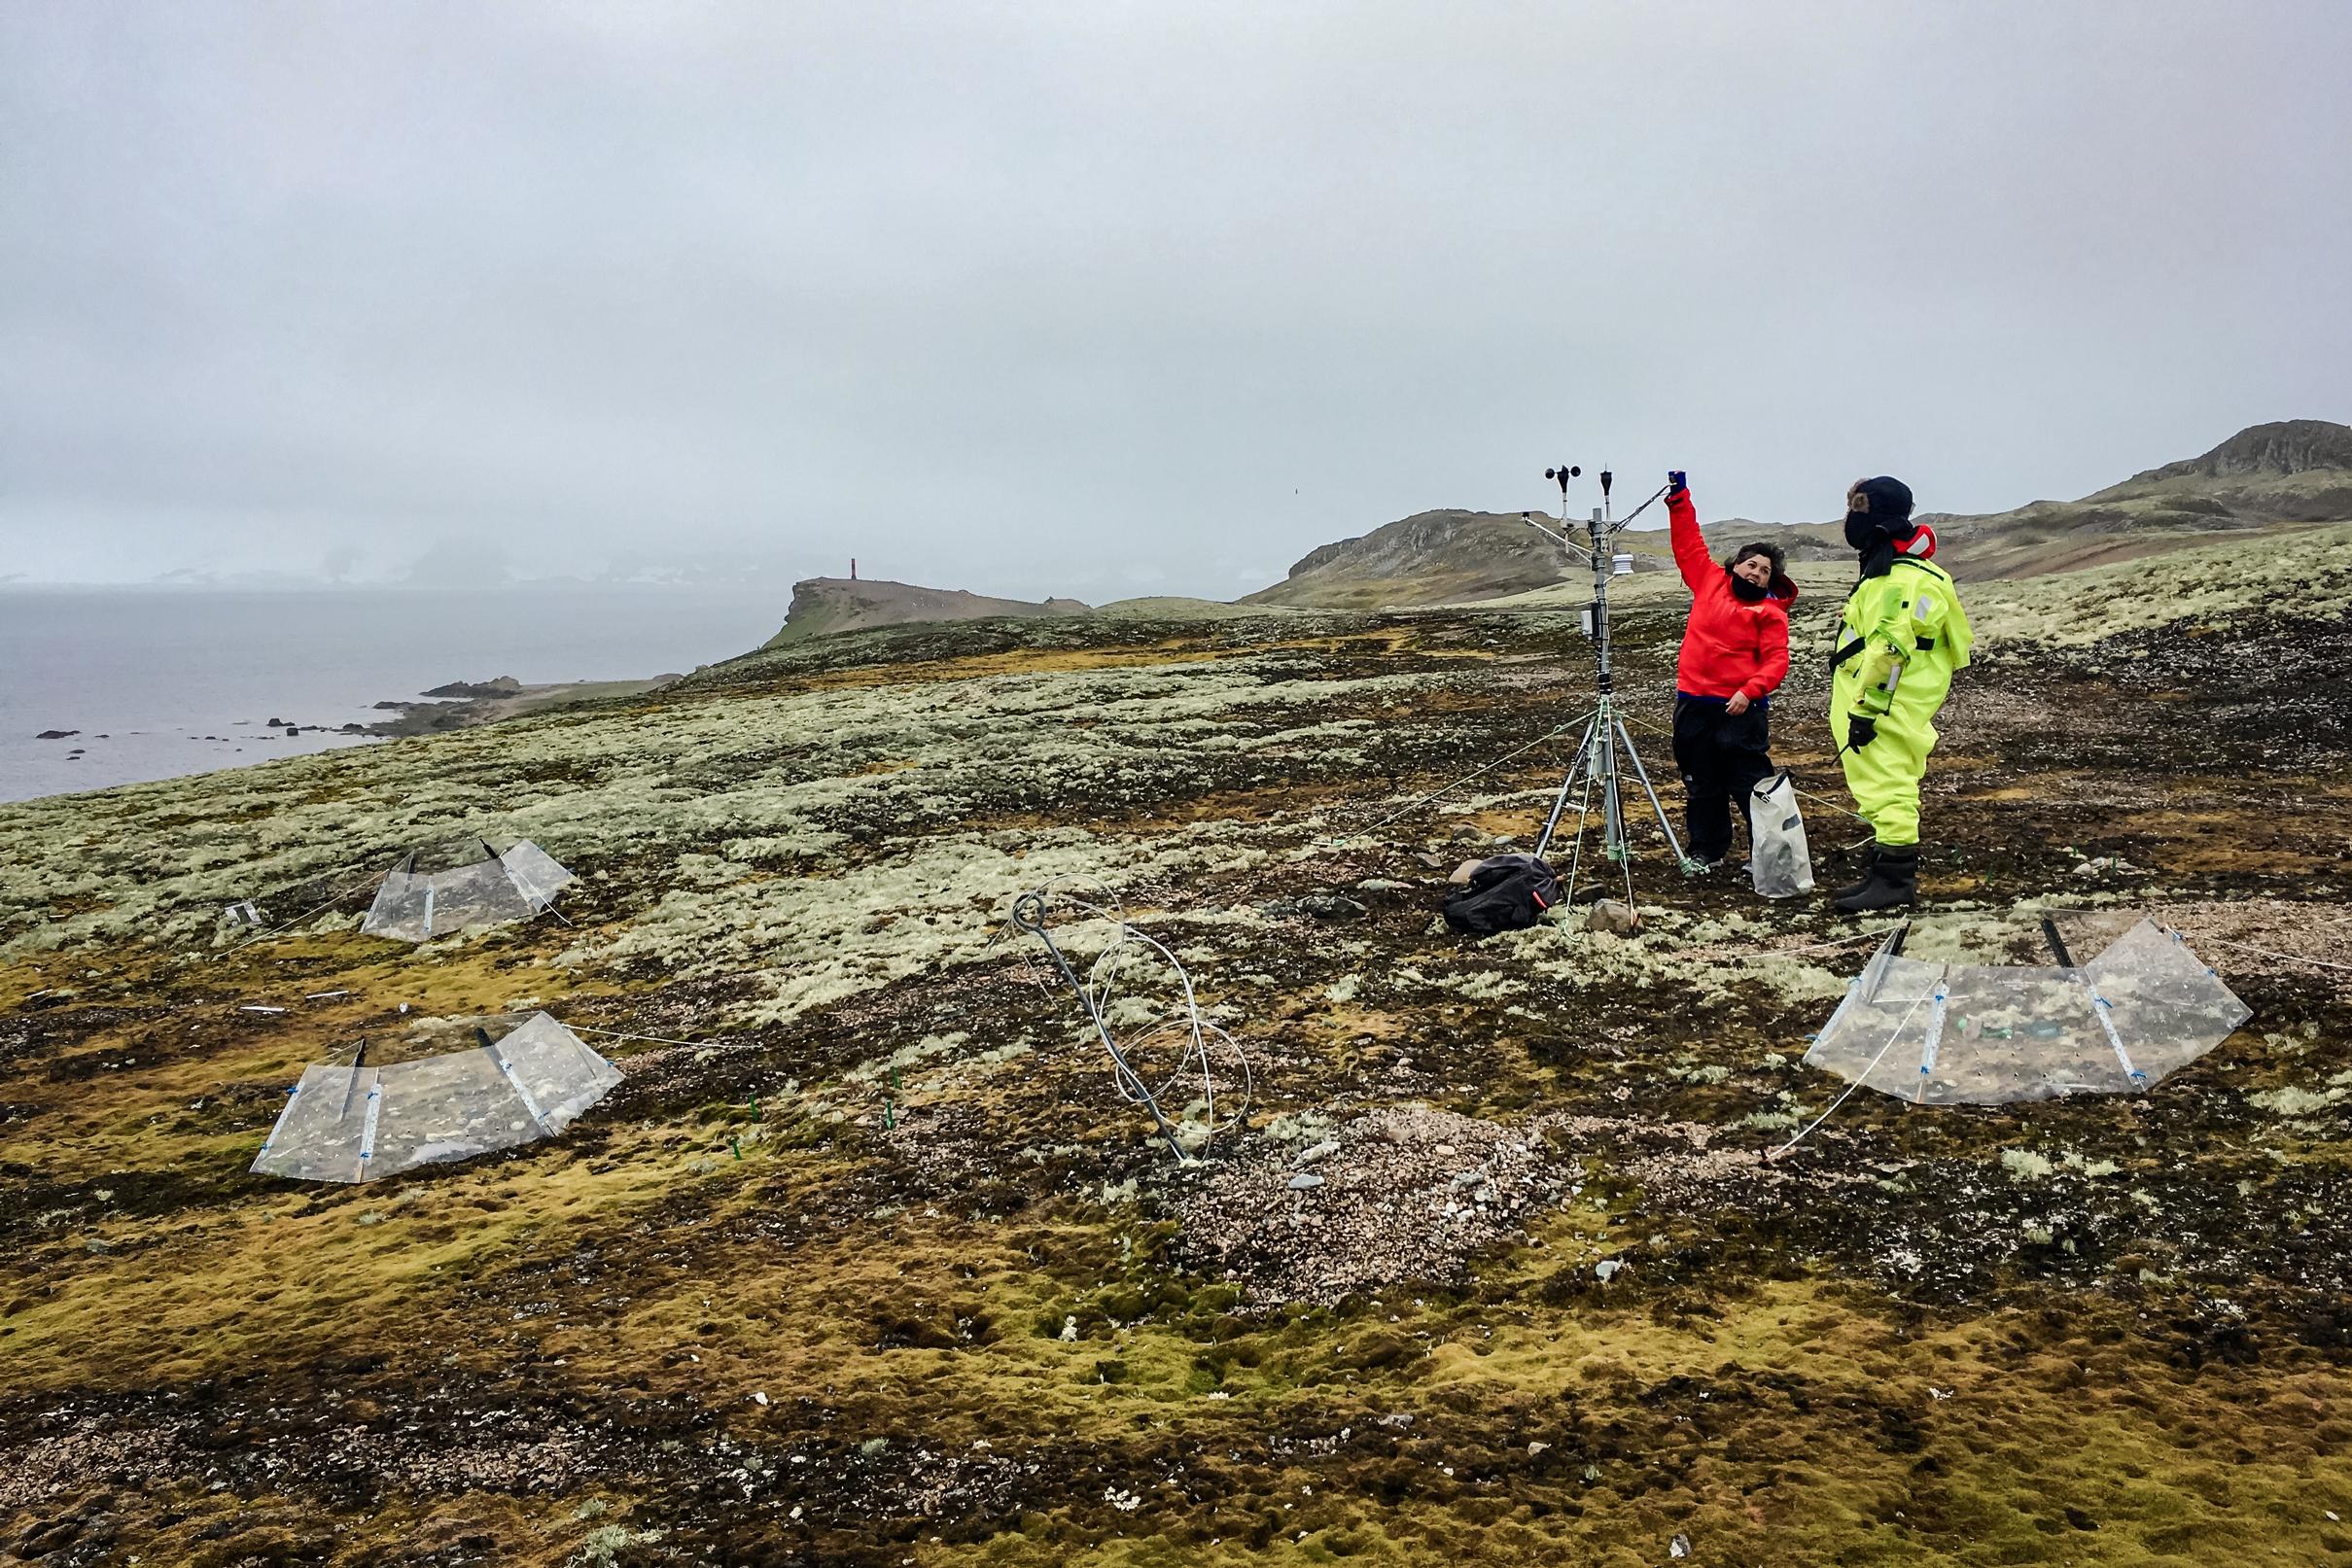
One of the scientists involved in the analysis, Peter O’Neill, has been tracking and downloading the data daily from the National Oceanographic and Atmospheric Administration (NOAA) and its Global Historical Climatology Network since 2011.
He found that each day, NOAA applies different adjustments to the data.

“They use the same homogenization computer program and re-run it roughly every 24 hours,” Mr. Connolly said. “But each day, the homogenization adjustments that they calculate for each temperature record are different.”
This is “very bizarre,” he said.
“If the adjustments for a given weather station have any basis in reality, then we would expect the computer program to calculate the same adjustments every time. What we found is this is not what’s happening,” Mr. Connolly said.
These concerns are what first sparked the international investigation into the issue by Mr. Soon and his colleagues.
Because NOAA doesn’t maintain historical information on its weather stations, the CERES scientists reached out to European scientists who had been compiling the data for the stations that they oversee.
They found that just 17 percent of NOAA’s adjustments were consistently applied. And less than 20 percent of NOAA’s adjustments were clearly associated with a documented change to the station observations.
“When we looked under the hood, we found that there was a hamster running in a wheel instead of an engine,” Mr. Connolly said. “It seems that with these homogenization programs, it is a case where the cure is worse than the disease.”
A spokesman for NOAA’s National Centers for Environmental Information downplayed the significance, but said the agency was working to address the issues raised in the papers.
“NOAA uses the well-documented Pairwise Homogenization Algorithm every day on GHCNm (monthly)—version 4, and the results of specific adjustments to individual station series can differ from run to run,” the spokesman said, adding that the papers in question didn’t support the view that the concerns about the homogenization of the data made it useless or worse.
“NOAA is addressing the issues raised in both these papers in a future release of the GHCNm temperature dataset and its accompanying documentation.”
Urban Heat Islands
One of the major flaws in the temperature data that creates a need for homogenization in the first place is the so-called urban heat island effect.In essence, the temperature stations that were once located in rural areas are now in many cases surrounded by roads, buildings, airports, and cities. This produces additional localized warming around the thermometer, which gives the appearance of drastic “global warming” when many similar stations are examined together.
The IPCC has acknowledged the urban heat island effect and the contamination of the data; however, according to the scientists who spoke with The Epoch Times, the U.N. agency has mistakenly assumed it’s a minor issue.
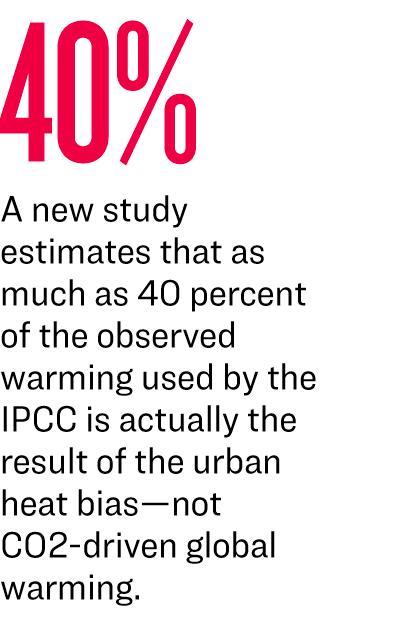
In a new peer-reviewed study, the coalition of scientists estimate that as much as 40 percent of the observed warming since the 19th century used by the IPCC is actually the result of this urban heat bias—not CO2-driven global warming.
“When we look at non-urban temperature data for the land, oceans, and other temperature records, the warming is much less dramatic and seems similar to other warm periods prior to the Industrial Revolution,” Mr. Connolly said.
The IPCC doesn’t control for the urban heat island effect, he said.
When Mr. Connolly and other scientists created a temperature record using only rural temperature stations, almost half of the global warming alleged by the U.N. body disappeared.
Indeed, the rural-only datasets match the weather balloon and satellite data much more closely.
“The Medieval Warm Period seems to have been about as warm as the modern warm period, but only when we use the rural-only record,” Mr. Connolly said.
While there has been global warming since the end of the Little Ice Age, if the urban datasets are excluded, all of the primary global temperature estimates show “that the planet alternates between phases of warming and cooling,” he said.
The current warming period began in the 1970s as scientists were still warning about alleged man-made global cooling, which had begun in the 1940s.
Michael Connolly, another independent scientist at CERES and Ronan Connolly’s father, noted that urban warming in cities, which cover about 3 percent of the Earth’s land surface, is in fact becoming a “major problem” that ought to be addressed.
“But, it cannot be cured by greenhouse gas policies,” he said. “Instead, we should be investing more into urban greening and other measures to try and reduce urban heat waves.”


Blending Rural and Urban Data
A separate issue with homogenization algorithms was examined in another paper published last year in the Journal of Applied Meteorology and Climatology.The problem, which Ronan Connolly and his colleagues refer to as “urban blending,” involves the comparisons made between temperature records from one station and others in the surrounding area.
If one seems way out of sync with the others, the program assumes it was a non-climactic bias that should be corrected.
Perhaps the biggest problem with this is that it allows urban warming to contaminate the entire temperature record by blending it with rural data.
The result is that urban and rural data are blended together, allowing some of the urban warming to be mixed in with the rural data that doesn’t have the problem.
“A useful analogy is if you mix strawberries and bananas in a blender, afterward you have a blended homogenous mix that is neither strawberries nor bananas,” Ronan Connolly said.
“Looking at the temperature data, this means that the homogenized rural records contain the urban warming, too.”
The supposed “unusual” global warming cited by the IPCC and other sources is only found in the urban data contaminated by heat associated with cities, he said. But by using the homogenized data, all of it becomes artificially biased by the urban heat effect.
“If we look at the temperature data that has not been contaminated by urban warming, it seems that the temperature changes since before the Industrial Revolution have been almost cyclical—cooling periods followed by warming periods,” Ronan Connolly said.
“This cannot be explained in terms of increasing greenhouse gases, since those have been only going upward. Instead, it suggests that the scientists who have been mistakenly mixing together urban warming with non-urban temperature changes have been chasing a red herring with their belief that CO2 is the main climate driver.”
However, not everyone is convinced that these issues are as significant as CERES scientists have suggested.
Professor Robert Lund, a recognized expert in this field and chair of the statistics department at the University of California–Santa Cruz, told The Epoch Times that the arguments put forth by Mr. Soon and his colleagues made him “cringe.”
“It is true that many climate scientists generally don’t use the best methods to clean up the data,” Mr. Lund said.
But the CERES scientists’ “contention that the warming inferences we are making are bunk because of the gauge changes and station relocation issues, and their suboptimal handling in homogenization procedures, are just not true,” he said.
“In fact, no matter how you deal with the changepoint issues, all globally averaged series (like the IPCC series) contain strong upward trends. It’s just that simple.”
The homogenization issue “might account for maybe 0.1 or 0.2 degrees Celsius per century of the 1.3 [degrees Celsius] that we are globally warming, but not more,” Mr. Lund said.
He accused the CERES scientists of “trying to take any amount of uncertainty, exponentiate it, and discredit everything.”
Asked if he was planning to refute their studies in a paper of his own, Mr. Lund said he and others in the field have grown weary of battling scientists who, he suggested, were mostly interested in discrediting the climate narrative.
A number of other scientists on both sides of the debate didn’t respond to requests for comment.
Other Problems
Historical temperature data don’t really exist prior to the 1970s, which hampers any type of long-term study.And outside of Europe and North America, there’s very little coverage.
Until recently, data from the oceans—making up more than two-thirds of the planet’s surface—were also sparse, confined primarily to occasional readings from major shipping lanes in the Northern Hemisphere.
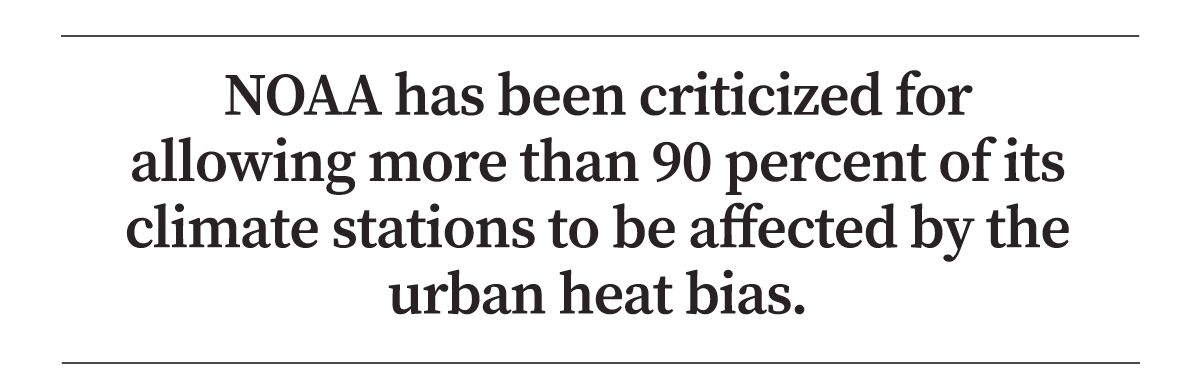
By 2022, about 96 percent of the stations failed to meet the agency’s own standards for reliability, a study by meteorologist Anthony Watts revealed.
Michael Connolly pointed out that when the weather stations were originally set up, they were meant to monitor day-to-day weather, not long-term climate changes.
“While most of the scientists that I talk to on a personal level admit that they have reservations about aspects of the current climate change narrative, they say that their institutions would suffer if they speak out,” he said.
Mr. Soon acknowledged that measuring climate change was a “very difficult scientific problem,” especially because the data are imperfect. But scientists have an obligation to be honest about that.
“Many research groups—in a rush to get grants and to get their work published—seem to have overlooked the serious problems of the data they are using,” he said, adding that many scientists are concerned about job security and are unwilling to speak out.
But some analysts who have seen the issues say it’s deliberate fraud.
Echoing the concerns about homogenization and blending, he told The Epoch Times that “the operating theory seems to be that mixing in a lot of very bad ingredients will create a good soup.”
Mr. Heller accuses NOAA of tampering with its data to create the “appearance of warming” and calls the global and U.S. temperature records “propaganda, not science.”
The misleading adjustments made to the data and the broader deception are “absolutely intentional,” he said.
“Trillions of dollars are being poured in to push global warming and climate change.”
So far, the studies by Mr. Soon and others haven’t been countered in any peer-reviewed literature.
Neither the IPCC nor NASA’s top climate scientist Gavin Schmidt responded to a request for comment.