Are We Heading for Stagflation?

Are We Heading for Stagflation?
A customer pumps gas into her vehicle in Miami, Fla., on Nov. 22, 2021. (Joe Raedle/Getty Images)
Gary Brode
2/8/2022
Updated:
2/17/2022
Commentary

Investors of a certain age will remember the economic difficulties in the United States in the late 1970s. The malaise of the time led to the use of the term stagflation used to characterize weak or negative economic growth combined with high inflation or high unemployment. In turn, this led to the use of the statistic called the “misery index” defined as the unemployment rate plus the inflation rate.

A high misery index leads to problems for two key reasons. First, having a large number of people unemployed at a time of rising prices pretty much defines the term miserable for an economy. Second, the Federal Reserve responds to inflation by raising interest rates which tends to have a cooling effect on the economy. This can raise the unemployment rate. So, during stagflation, the Fed is left with the choice of making the cost of living more expensive for everyone, or addressing the inflation problem at the expense of more people being unemployed. Both paths have negative effects.

A graph showing the misery index over the last 70 years. (Courtesy of <a href="https://ycharts.com/dashboard/?utm_source=Deep%20Knowledge%20Investing&utm_medium=newsletter">YCharts</a>)
A graph showing the misery index over the last 70 years. (Courtesy of YCharts)

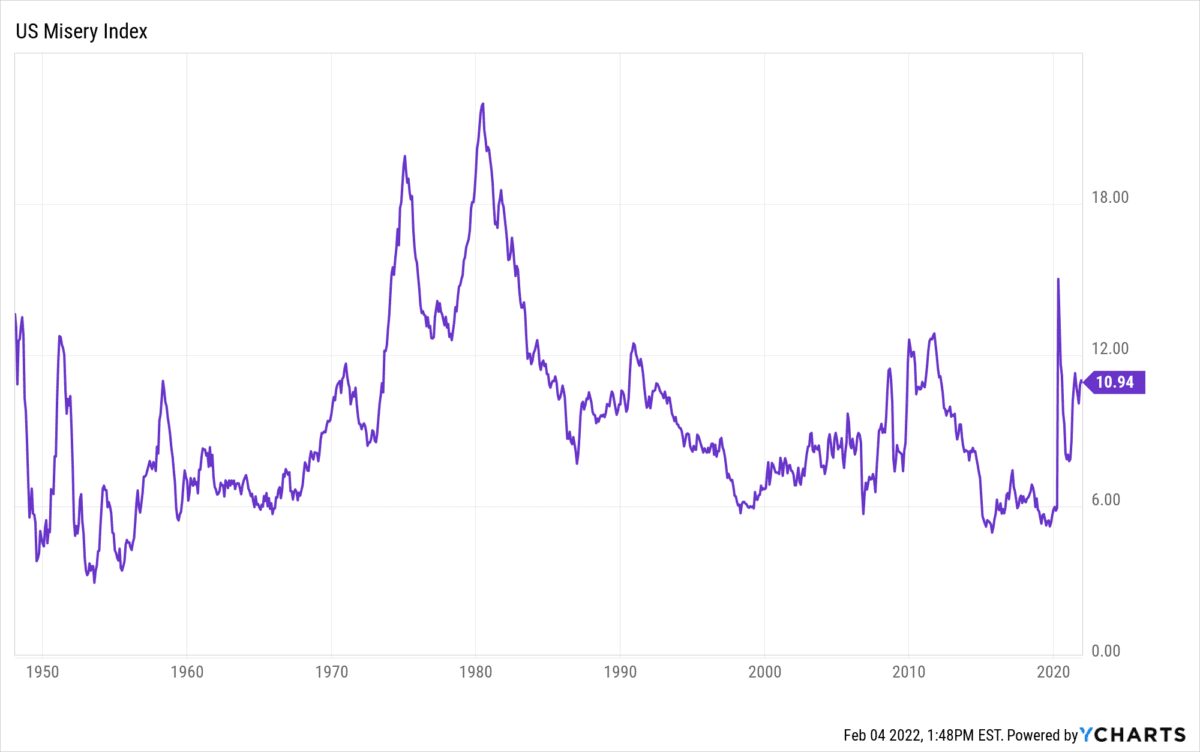
Looking at the misery index, we can see the spikes when President Nixon took us off of the gold standard and larger one at the end of the Carter years. There was another jump associated with the 2008 financial crisis, and also a big spike when the COVID-19 lockdowns forced the unemployment rate to temporarily high levels. The recent increase is related to inflation.

I’m on record in the pages of this newspaper explaining that we think the current inflation rate is understated. While the official Consumer Price Index (CPI) number was 7 percent in December, we believe the real rate of price inflation being experienced by American consumers is closer to the mid-teens. For more detail on how we determine that, here’s The Epoch Times article explaining it. If we’re right about the real rate of inflation, the current misery index isn’t 11; but rather, is in the high-teens which is very close to the all-time high of 21.

We’re also concerned that Gross Domestic Product (GDP), the standard measure of economic growth is also overstated.

A graph showing U.S. economic growth as measured by GDP. (<a href="https://www.bea.gov/">U.S. Bureau of Economic Analysis</a>, Graph by Deep Knowledge Investing Intern, Guru Sidaarth)
A graph showing U.S. economic growth as measured by GDP. (U.S. Bureau of Economic Analysis, Graph by Deep Knowledge Investing Intern, Guru Sidaarth)
The December GDP number of 6.9 percent represents excellent economic growth, and that’s less apparent in the graph above due to the huge effect of the COVID-19 lockdowns followed by the recovery of normal economic activity. However, fellow Epoch Times columnist, Mish Shedlock, makes an excellent case for why the 6.9 percent figure doesn’t reflect actual economic growth. He points out that Change in Private Inventories were a 4.9 percent addition to GDP. This wasn’t an increase in real economic activity; but rather, a restocking of shelves. That’s not repeatable.

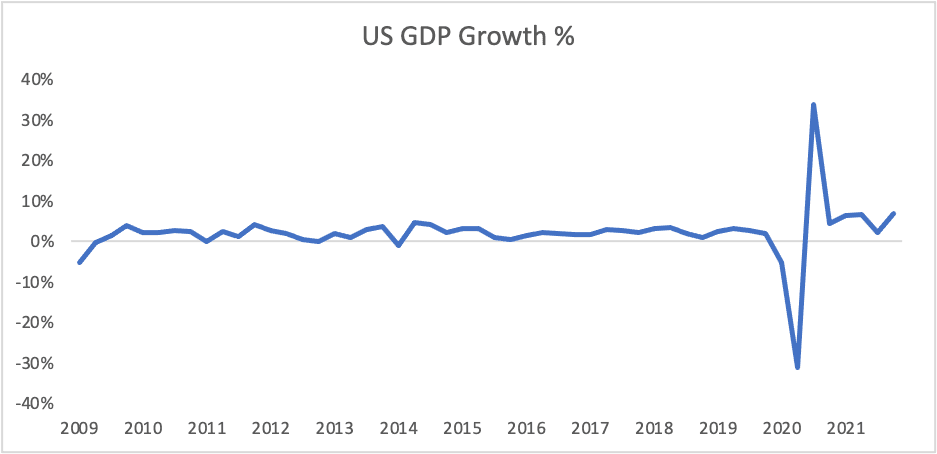
In addition, GDP numbers are inflation-adjusted. There’s a good reason for this. Take the example of a baker who bakes and sells a loaf of bread for $1. If there’s price inflation and the same baker sells the same loaf of bread the following year for $2, that doesn’t represent a doubling of economic activity. It’s merely the same economic activity combined with inflation. Shedlock points out that the adjustment for Gross Domestic Purchases (essentially, the inflation adjustment) was 3.9 percent for 2021. I add that the adjustment was 6.9 percent for the fourth quarter. It’s clear from our work on inflation (cited above) and from the volume of comments from Epoch Times readers regarding their rising cost of living that these figures are understated.

If we take the stated 6.9 percent GDP number, and adjust for inventory restocking, we get a net number of 2.0 percent. We believe that inflation is being understated by 5 to 8 percent which would take that GDP number negative. Finally, there’s one more factor we’re tracking. The Port of Los Angeles along with the Port of Long Beach handle 40 percent of inbound United States imports. It’s been widely reported that the Port of Los Angeles in particular has been backed up and that the times required for truckers to pick up a load has increased substantially.

In October, the White House announced a plan to fix the port congestion by running the two ports 24 hours a day and by fining companies that didn’t pick up containers fast enough. Here’s what happened:

A graph showing the number of containers imported at the Port of Los Angeles. (Courtesy of Port of Los Angeles)

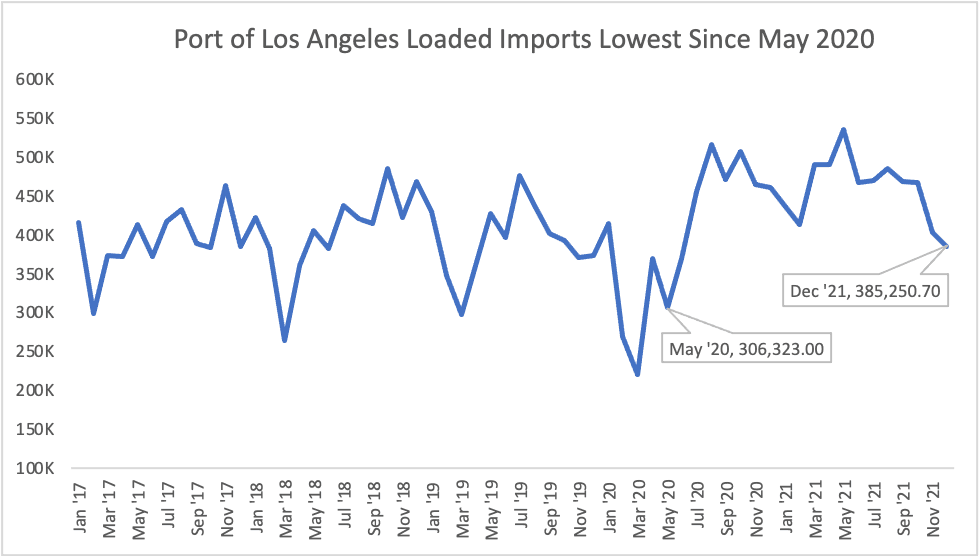
Import volume went from down 7.8 percent in October to down 13.2 percent in November to down 16.4 percent in December. Clearly, the White House and the Transportation Department did not fix the problem. The reason that this matters is because net imports are subtracted from GDP. While it’s true that due to port congestion, exports (which are added to GDP) also fell, because the United States imports more goods than it exports, the net effect of the ports moving fewer goods is a temporary addition to GDP figures. Adjusted for something closer to a free-trade ideal and the “excellent” recent GDP number is even further negative.

To us, it looks like U.S. economic growth may have already turned negative, and only appears positive due to temporary adjustments and sleight of hand. A recession is defined as two quarters of negative GDP growth. If that is starting at the same time the United States is experiencing the worst inflation numbers in 40 years, we could be looking at stagflation on the way. There are basic things you can do to protect yourself from these negative economic consequences which we’ve addressed in these pages.
Gary Brode has spent three decades in the hedge fund business. Most recently, he was Managing Partner and Senior Portfolio manager for Silver Arrow Investment Management, a concentrated long-only hedge fund with options-based hedging. In 2020, he launched Deep Knowledge Investing, a research firm that works with portfolio managers, RIAs, family offices, and individuals to help them earn higher returns in the equity portion of their portfolios. Mr. Brode’s work has been featured in the Wall Street Journal and Barron’s, and in appearances on CNBC, Bloomberg West, and RealVision.
Related Topics