This copy is for your personal, non-commercial use only. Distribution and use of this material are governed by our Subscriber Agreement and by copyright law. For non-personal use or to order multiple copies, please contact The Epoch Times Reprints.
April jobs printed at 428,000 new jobs, above the consensus estimate of 380,000. The unemployment rate was 3.6 percent. The Labor Participation Rate was just 62.2 percent, down 20 basis points (bps, or 1/100th of a percentage point) from last month. February and March jobs were revised downward by 39,000 net jobs. The U6, which is total unemployed, plus all persons marginally attached to the labor force, plus total employed part time for economic reasons, ticked up to 7 percent from 6.9 percent last month, but down from 10.3 percent from last year.
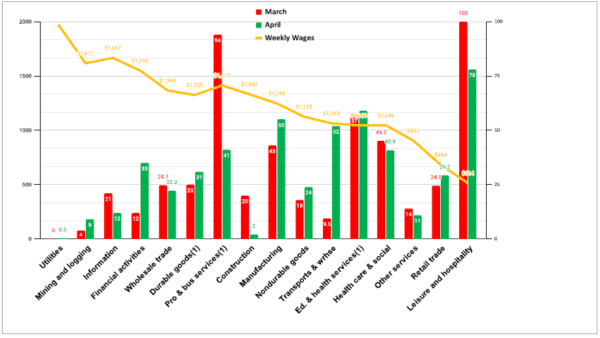
Real wages, which we define as annualized average weekly wages less the 12 month average trimmed mean inflation rate for Personal Consumption Expenditures, for March (the latest available) were mixed, with Professional and Business Services showing the biggest annualized real wage gains as workers in the Information sector showed the greatest annualized real wage losses. (We detail this data each quarter.)
March and April Jobs Creation by Average Weekly Wages. April Jobs Report from the Bureau of Labor Statistics/The Stuyvesant Square Consultancy
Job gains were earned across a variety of sectors. The best-performing jobs sector was Leisure and Hospitality, which produced 7o,000 jobs. The worst sector was Utilities, with a barely noticeable 300 new jobs.
Other Data
Some other prints this week were both disappointing and disconcerting.
The Institute for Supply Management’s print of the Manufacturers Purchasing Managers Index the Manufacturing PMI® (pdf), registered growth in April, at 55.4 percent, but down 1.7 percentage points from last month when it was 57.1 percent. A reading above 50 signals growth, but the April figure is the lowest since July 2020 when it printed at just 53.9 percent.
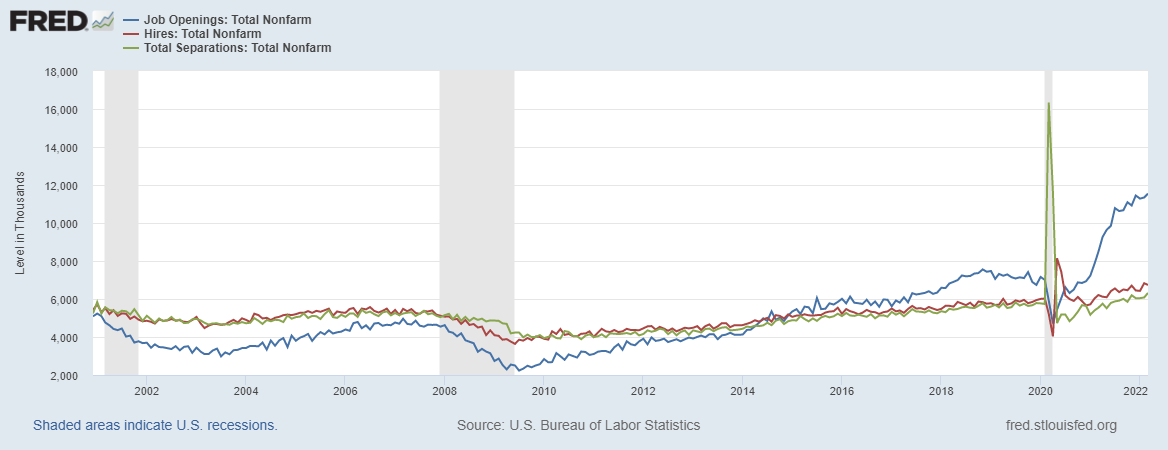
Jobs openings and labor turnover (JOLTS) was troubling and printed at a record high since the data started being accumulated in 2001. As illustrated, the jobs separation at the height of the pandemic does not appear to have been matched. The job openings will tend to drive wages—and thus inflation—higher.
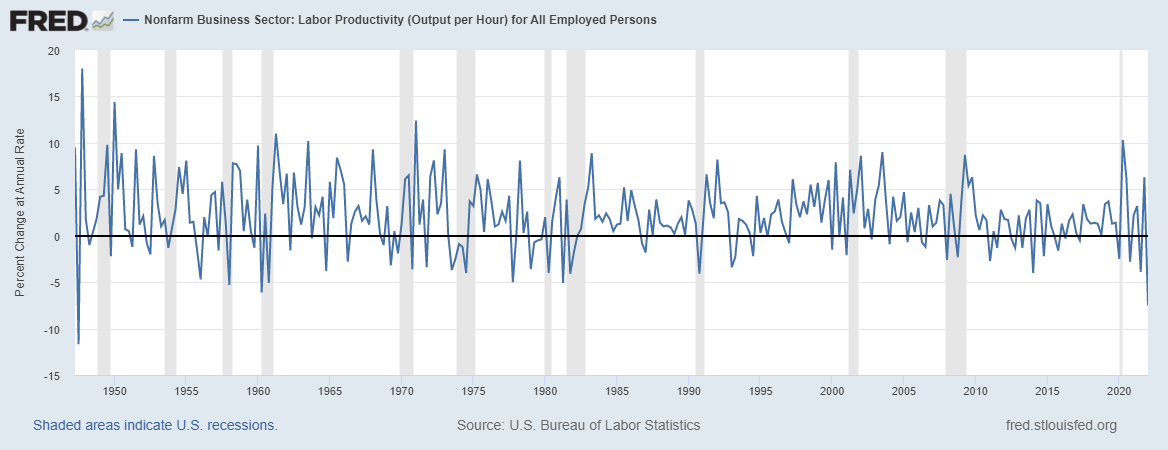
Labor Productivity
Perhaps the most troubling data point recorded from the first quarter is a startling drop in labor productivity. It dropped 7.5 percent, the greatest drop since 1947 when it fell 11.7 percent. Unit labor costs increased by 11.6 percent.
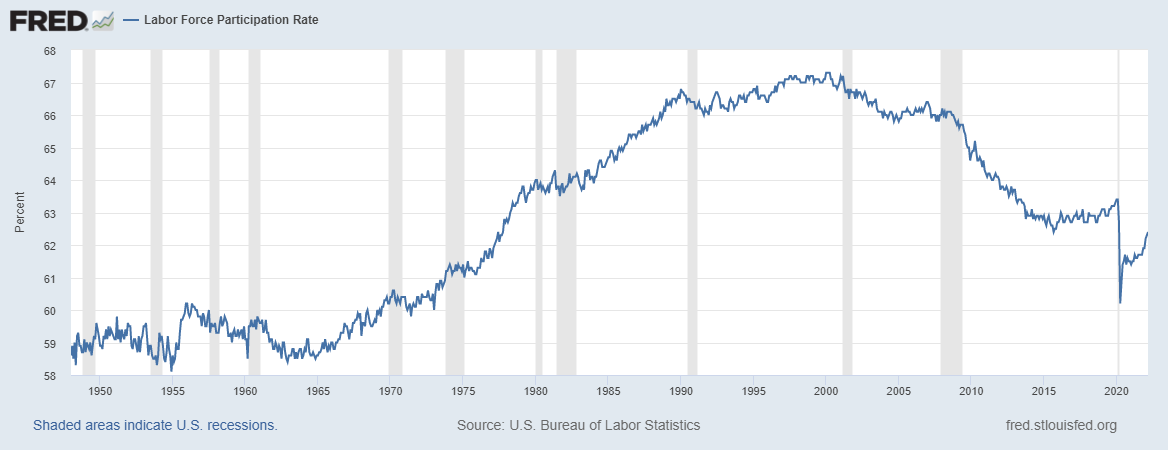
Equally disappointing is today’s Labor Force Participation Rate at just 62.2 percent. Fewer people working with lesser productivity will generate fewer goods and services and, thus, higher inflation, as explained further below. Prior to the pandemic, the Labor Force Participation Rate was 120 bps higher at 63.4 percent. Prior to the 2008 financial crisis, it was at 66 percent, further evidence that we have not resolved the economy from that melt-down.
The productivity and labor participation rates directly affect the rate of inflation that we have seen.
I’ve quoted Milton Friedman previously in these pages in what may be his most oft-cited, simple, rule: “Inflation is always and everywhere a monetary phenomenon.”
That quote is supported by a simple theorem: MV=PQ
Where:
M is the money supply;
V is the velocity—the rate of turnover—of money in the economy;
P is the price of goods; and,
Q is the quantity of goods produced.
M, the money supply, is at a record high, at over $22 trillion, just shy of the entire U.S. economy of about $24 trillion. But while the quantity of goods is at a record high in terms of value, it is well off what it would have been without the pandemic. The pre-pandemic trajectory would have been about 10 percent—or $2.4 trillion—higher.
A good deal of the current inflation is attributable to too much money in the economy and the quantity of goods being produced. With a relatively low labor participation rate, productivity needs to increase, not decrease as it did, to produce more goods and lower the inflation rate. Moreover, the shortages in specific critical goods, like diesel and fertilizer that I discussed here, will cause food -- and thus all other -- costs to continue their upward trajectory.
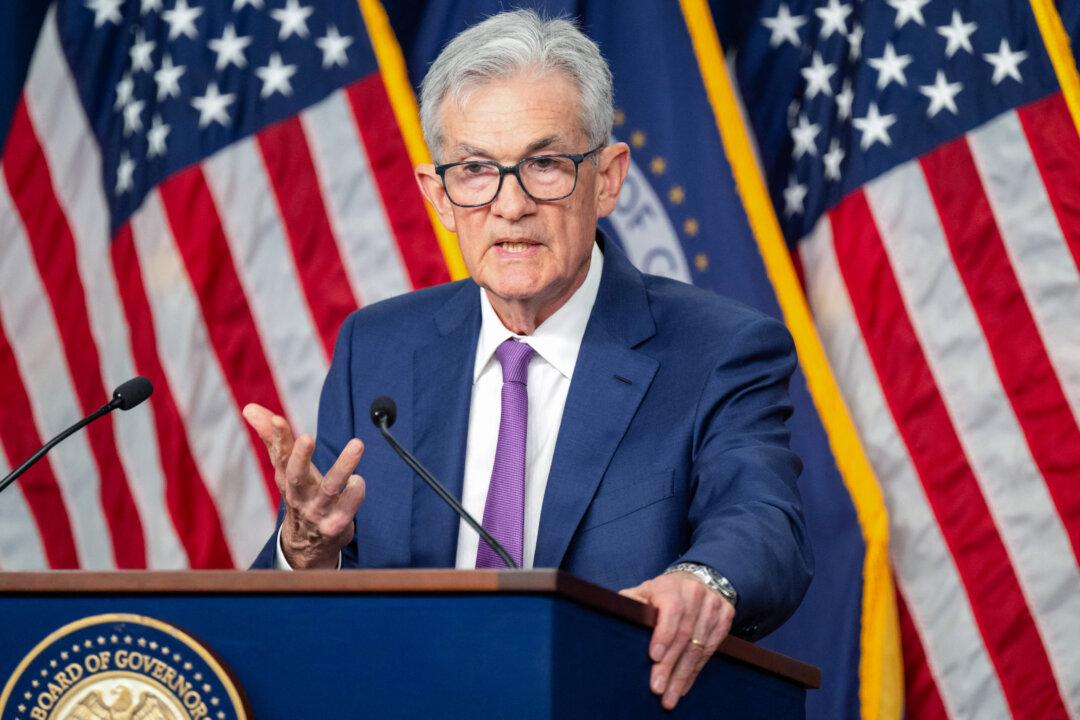
The Fed’s decision to raise the federal funds rate a half-point to between 75 or 100 bps will not reduce inflation; it will likely only affect the equities market. It is intended to keep inflation at bay, but not reverse it, in the hope of creating a “soft landing”—no recession—for the larger economy.
More important is the Fed’s decision to finally reduce its balance sheet, something I’ve been urging since last year. Still, the decision to simply let assets “burn off” at their maturity is insufficient. The Fed should be selling assets to reduce the level of M2 in the economy and to further bring the long-term rates into line with inflation.
Note that the 10 year yield has gone from 2 percent on Friday, March 11th, to over 3 percent this morning. But despite the rapid increase, it is well below the rate of inflation, so that may speak to how the market views the longer tail of inflation (i.e., that it will not be long-lived.) In my view, so long as the Fed takes just half-measures, that view is likely mistaken.
Events in the News Cycle
On Monday, December 8, 1941, the day after the Japanese attack on Pearl Harbor, the Dow Jones fell over 3 percent. It fell yesterday more than 3 percent, despite the Federal Reserve announcements Wednesday having little effect. The Fed move, we believe had been priced into the market for quite some time.
We think yesterday’s market plunge may have had a good deal to do with a New York Times story, now denied, that the United States was helping Ukraine to target Russian generals, perhaps more than any “reassessment” of the Fed’s commentary from Wednesday. (The story printed on May 4th, but that may have been very late in the day (it has no timestamp); I noticed it on May 5th, and posted a tweet at 7:26 a.m. yesterday when it appeared at the top of the Times’ rundown of the day’s events in Ukraine.)
My view is that story—dangerously escalating U.S. involvement in the Ukraine-Russia War and implicating us as a potential, targetable, combatant—did more to move yesterday’s markets by the funds and institutions than anything the Fed did. It certainly exacerbated it. Markets don’t like war, particularly between nuclear-armed opponents.
Another factor in yesterday’s market rout was Sen. Elizabeth Warren’s (D-Mass.) prognostication that there “was a consensus forming” to impose a minimum tax on the income corporations report for financial accounting purposes, not conventional taxable income.
Note, too, that as equities were beaten down yesterday, there was little flight to the safety of bonds, which is unusual. For foreign investors, this may have been a consequence of the Biden administration’s failed effort to weaponize the dollar against Russia over Ukraine, something I warned of back in February, here.
Commentary
The likelihood of a “soft landing” is almost nil. Inflation has run too high, too long, and beating it down will take far more effort than the Fed has imposed. I would prefer a steeper, shorter, recession than a lengthy period of maudlin performance, even though it will take down equities jacked up by leverage and easy money.
Even after the series of the Fed’s future half-percentage rate increases, we will still be below r*, or “r-star,” the theoretical natural—or neutral—rate of interest that compensates lenders for the use of money and without account for inflation. This was part of what Larry Summers has been warning for some time.
The most likely scenario we see here is a recession starting in the second quarter of 2023. Meantime, we think Second Quarter GDP will print at around 1 to 1.5 percent.
Investing
There are not a lot of good choices. As advised some months ago, we are in a risk-off market.
It’s a good time to hold cash and AAA or AA bonds. (I'd avoid big-city municipals and their insurers for multiple reasons beyond the current economy.)
In equities, commodity-ETFs (exchange-traded funds) are probably best, particularly those in the energy sector. Consumer staple ETF that invest in things like food, cleaning products, healthcare, and pharmaceuticals are most likely to maintain value over what promises to be a very volatile equities sector. Selected single stocks with good cash flow and a low price to earnings (PE) ratio might also supplement portfolios. Some lower-end retailers might be advisable with a low PE as might be some leisure and hospitality stocks.
DISCLOSURE: The views expressed, including the outcome of future events, are the opinions of The Stuyvesant Square Consultancy and its management only as of May 6, 2022, and will not be revised. Statements herein do not represent, and should not be considered to be, investment advice. You should not use this article for that purpose. This article includes forward-looking statements as to future events that may or may not develop as the writer opines. Before making any investment decision you should consult your own investment, business, legal, tax, and financial advisers. The writer is Managing Director of the Stuyvesant Square Consultancy which associates with principals of TechnoMetrica on survey work in some elements of our business.
J.G. Collins is managing director of the Stuyvesant Square Consultancy, a strategic advisory, market survey, and consulting firm in New York. His writings on economics, trade, politics, and public policy have appeared in Forbes, the New York Post, Crain’s New York Business, The Hill, The American Conservative, and other publications.