Here we share our exclusive analysis of 30 years of monthly housing price data from the Federal Housing Finance Agency (see the graph and table below), including seasonal price changes of houses in the Pacific region as well as for the entire United States.
We looked at the changes in house prices from the peak of the traditional homebuying season—early August—to the bottom of a typical year’s homebuying activity—early December.
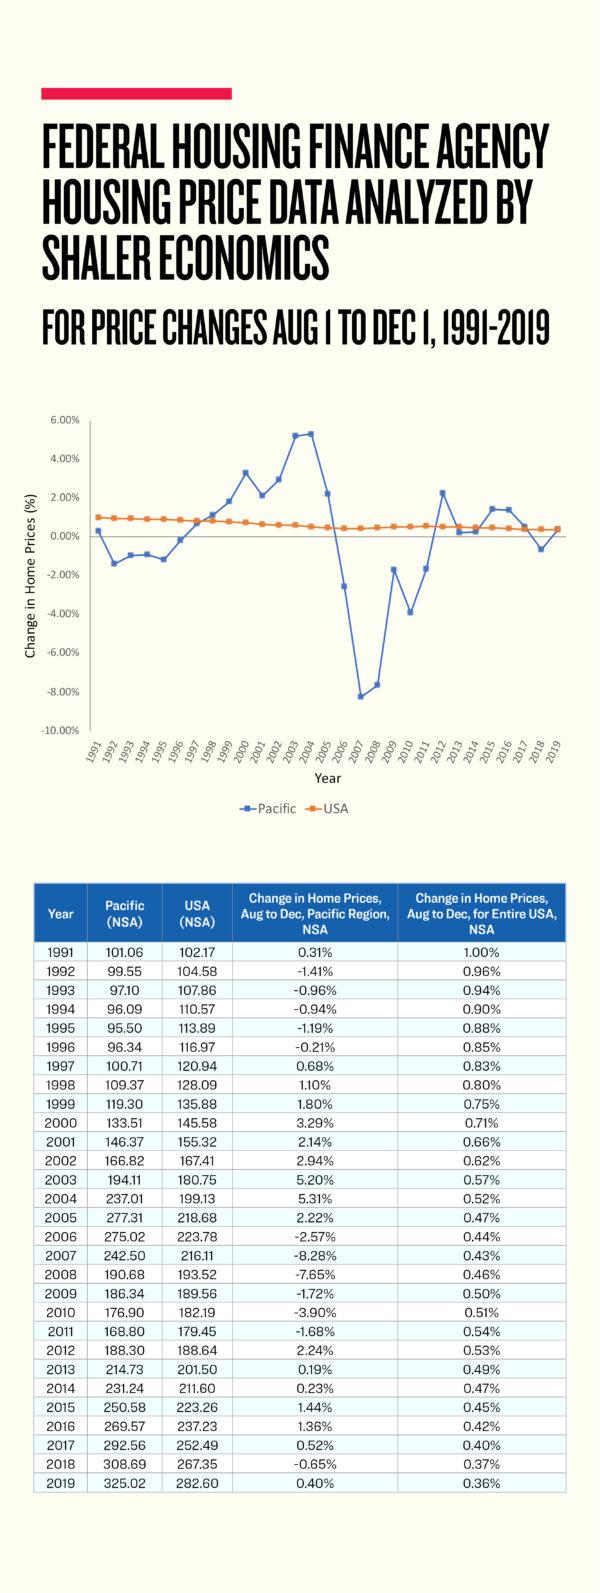
As you can see, for the Pacific region, in 12 of the past 29 years—41 percent of the time—there has been a decrease in housing prices from August, when market activity typically peaks, to when it generally nears its lowest, between Thanksgiving and the December holidays.
On average, the seasonal change from the peak-activity season to the bottom-activity season during these 29 years has been basically unchanged. But that average masks big price declines in some years, and some pretty strong price increases in other years.
The “standard deviation” of price changes from Aug. 1 to Dec. 1 over that period, for the Pacific region, is 3 percent. That means that 68 percent of the time, the change in price was within a range of –3 percent to +3 percent.
The rest of the time, prices went down by more than 3 percent or up by more than 3 percent.
In thinking about the current year, 2020, with interest rates at very low levels, one might look at the years 2002–2004 as a guide. The economy was coming back from the “dot.com bust” as well as from the 9/11 terrorist attacks. At the same time, though, interest rates were very, very low, as they are now.
On the other hand, though, one might also look at the years 1992–1996 as a guide. California’s economy was generally “turning the corner” from a severe regional recession brought on by massive reductions in defense spending at the end of the Cold War, when California and Seattle had a disproportionately high share of military bases and military contractors. So, those years might be seen as a guide to what “normal” looks like, and one might expect mild seasonal price decreases.
This year, the very low interest rate environment and homebuyers seeking larger homes might particularly bolster home prices in Orange County and in the Inland Empire.
At the same time, schools will eventually reopen and parents will become unwilling to uproot their children from school (the normal reason real estate activity eases so much after Labor Day).
This might cause a sharper-than-normal decrease in buyer activity this year versus other years.
Totally differently, though, one might look at this data and notice the sharp home price declines of 2007 and 2008, and reasonably speculate that something similar might happen in 2020. With the Mortgage Bankers Association saying that some 7 percent of all homeowners are currently in some form of mortgage forbearance, we can see there is some risk that only desperate sellers will be selling their homes during the holiday season. If that happens, there might be a noticeable seasonal price drop that may be advantageous for homebuyers. In 2007 and 2008, there was a severe global recession taking place.
Therefore, one can assume that sellers selling their homes during the holiday season in those years probably were more desperate to sell than those who could have waited four months to try to sell during the traditional annual homebuying season—which typically starts around Easter and spring break time.
Of course, one can’t predict future events. The current very low interest rates may not last forever. And even though disruptions inside the mortgage market seem to have been fixed, if global investors believe the pandemic might soon come to an end, the interest rate on the 10-year Treasury bond might move back up to the 2.5 percent level of rates that had existed beforehand.
All else equal, in that scenario, one should expect all market-based interest rates, including mortgages, to increase 180 basis points, or 1.80 percentage points. That would remove a major boost to the current homebuying activity. However, the U.S. Federal Reserve might choose to keep buying more mortgages (it has already bought more than $1 trillion since March) and keep overnight interest rates near zero—in which case, mortgage rates may not go up very much.
All these factors are in flux, and all of them are affecting the housing market.
Homebuyers and sellers are encouraged to know their local market very well (all real estate is local) and not be fooled into believing that what has been true these past two months will necessarily continue after schools reopen for in-person instruction and as we approach the traditional winter holidays.