Commentary
April jobs printed at 175,000 new jobs, according to the Establishment Survey from the Bureau of Labor Statistics (BLS), a collection of job creation data from businesses, well below the 238,000 consensus estimate of jobs creation. February and March jobs creation revisions were down by 22,000 jobs, net. The BLS’s Household Survey, which calculates the number of people taking jobs, and is viewed as eliminating workers taking more than one job, showed 182,000 more people working in April than in March. Some 87,000 people joined the U.S. workforce.
Let’s look at our exclusive schedule of March Jobs by Average Weekly Wages:

Higher-paying jobs creation was, again, virtually moribund. Lower wage jobs, such as in leisure and hospitality, retail, and other services, and jobs that tend to have government support, like education and health services, health care, and social services generated the majority of the new jobs creation in the Establishment Survey. There were 8,000 new jobs created in government. (We do not include government jobs in our chart.)
Economy Generally
GDP growth moderated from 3.4 percent in the fourth quarter of last year to 1.6 percent in the first quarter. Federal Reserve Chair Jerome Powell points out, though, that Private Domestic Final Purchases, which excludes inventory investment, government spending and net exports, printed at 3.1 percent and, he believes, is a better indicator of underlying demand. Net exports printed negatively in the first quarter of 2024.At the moment, the United States is at the top of the G7 economies—the United States, United Kingdom, France, Germany, Italy, Japan, and Canada—in terms of its GDP growth. But U.S. growth is arguably just “the tallest pygmy,” especially compared with other economies, and particularly some developing economies. See the chart from the International Monetary Fund (IMF), below, and its interactive counterpart here.

Particularly troubling, though, is that so much of the U.S. GDP growth, as well as job growth, is fueled, directly and indirectly, by enormous government spending. This other chart, from the IMF, shows how excessive our debt-to-GDP ratio is relative to other economies.
Related Stories


So much of the purported U.S. “growth” is from government spending. This chart shows direct federal and state and local government contributions to GDP, in percentage terms. It is the second-largest contributor to GDP, as illustrated here:
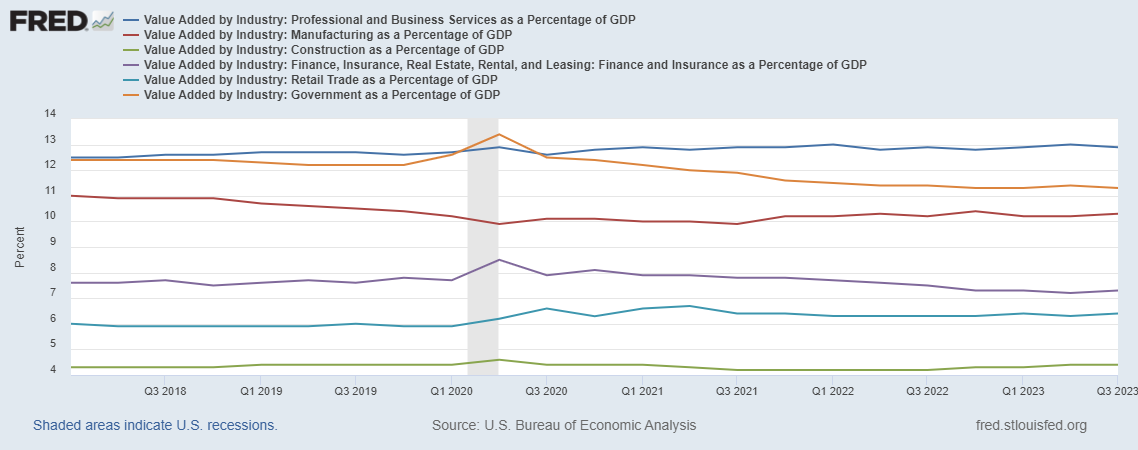

But buried in the private economy growth rates in industries such as construction, real estate, and business services are things like the nearly $52 billion in federal grants and incentives given to companies like Intel, TSMC, and Samsung to construct microchip fabs (manufacturing facilities) in the United States. Buried in the GDP growth, too, is the billions being spent on social welfare and health care.
Federal Reserve Policy
The Federal Reserve said on May 1 that it would keep rates stable, but also said it would reduce the rate at which it buys back securities. The reduction disappointed us.We have said for quite some time that the Federal Reserve ’s balance sheet is too large, much larger than it should be, given how far we are from the pandemic. As of April 1, the Fed balance sheet was still at $7.4 trillion, well exceeding the $7.1 trillion it was in June 2020, at the height of the pandemic, and roughly the same $7.4 trillion as at the start of the Biden administration in January 2021. It has not been reduced at all since he took office. Before the pandemic, the Fed’s balance sheet was just $4.1 trillion.
We believe the Fed is loosening its rate of quantitative tightening because of the enormous risk to the banking sector as commercial real estate loans originated in the aftermath of the financial crisis of 2008–09 come to maturity and require refinancing. Many of those loans will have to be refinanced at rates that are already three percentage points higher than they were when the loan originated. Those financing costs, together with the enormous cost increases in commercial insurance costs, will hinder cash flows and cause many owners of commercial real estate to simply default and “hand over the keys” to the lender.
Nevertheless, we believe, as we have said for months now, that monetary policy, and the Fed’s effort to assure a “soft landing” ahead of the 2024 elections, continues to be far too accommodating, and has been a longer-term mistake. We see it in the continuing trimmed mean inflation rate, which has ballooned throughout President Biden’s term. Continuing inflation bears out the obvious effect of the excess money supply.
Fiscal Policy
Readers should look at the schedules of “Household Debt and Credit” prepared quarterly by the Federal Reserve Bank of New York for some troubling debt and delinquency figures, particularly among Generation Z—young people 18–29 who are the principal drivers of family formation that drives so much of GDP.The administration’s fiscal policy is adding an additional $1 trillion to the national debt every 100 days. All that cash sloshing around—from fiscal and monetary policy—has, we think, artificially boosted asset prices, including home prices and securities values, above where they would otherwise be. We believe it sets up a reckoning in the future: either continued inflation (as the spending continues and deficits increase) or a sharp and perhaps lengthy recession—the kind of lengthy economic malaise we saw after the financial crisis of 2008–09.
Failing to arrest this fiscal and monetary policy—and soon—will, we believe, result in a Hobson’s choice of policy making, where future prosperity is at substantial risk. But given the promises of higher taxes, and more spending that the president made last night, we are not optimistic.
Looming ‘Gray Swans’
There are at least four looming so-called “gray swans” facing the economy. Gray swans, as opposed to “black swans,” are events that can be foreseen, but are unlikely. Black swans are totally unpredictable. (A gray swan is comparable to a hurricane in hurricane season, whereas a black swan would be something like a devastating earthquake.)
Virtually all of the looming gray swans we can foresee are attributable to bad national policy choices. They include:
1) De-dollarization—The choice to try to weaponize the dollar against Russia for its invasion of Ukraine has led several nations to do direct settlements in their own currencies. We discussed the prospect of this happening here in February 2022. It has now come to be with the passage of the “21st Century Peace Through Strength Act” (H.R.8038), which I discussed further here.
2) Oil shock—We now are at the lowest level of Strategic Petroleum Reserve (SPR) in over 40 years. The Biden administration tapped America’s SPR to artificially lower oil and gasoline prices shortly after a 2021 election loss by prominent Democrat Terry McAuliffe for his governor’s race in blue/purple state Virginia. New Jersey’s incumbent Democrat Governor Phil Murphy barely squeezed out a win over his GOP opponent in that same election cycle in that deep-blue state. At the time, The Washington Post said the results showed the “wind was at the back” of the GOP. The Biden White House did the same in October 2022, shortly before the midterm federal elections.
3) Municipal bankruptcy—The stress and costs of migrants could force a technical default on a municipal general obligation bonds of some “sanctuary cities.”
4) Troubled clearings of Treasury auctions—With no discernible plans by the White House or Congress to address spending or taxes, it may occur that the bid/ask on U.S. Treasurys mismatch as demand fails meet the supply, thereby causing a substantial rate increase. This happened in November 2023, when a lack of demand caused an auction of 10-year Treasurys failed to clear, causing rates to increase.
Meanwhile, we expect GDP for the second quarter to print later this month (April 25) at around 2.00 percent, +/- 25 basis points and the economy to slow and unemployment to rise. We also think we’re on the cusp of a “stagflation” cycle, with tepid growth, higher unemployment, and continued inflation.
April Other Data Points
The Institute for Supply Management’s Manufacturer’s Purchasing Managers Index (PMI) at 49.2 for April, showing the industrial economy contracting, and thus continuing the 16 months of contraction that had been interrupted by a March growth number of 50.3. (A reading below 50 signals contraction.) Despite the decline, prices increased substantially, by 5.1, to 60.9. The April ISM Services Index showed contraction, from growth, at 49.4 versus 51.4 in March with slower growth.The Job Openings and Labor Turnover Survey (JOLTS) for March, released May 1, printed slightly worse, with 325,000 fewer jobs openings in March than in February, but there were 339,000 few job separations in March than in February. Total hires declined by 281,000.
Privately owned housing units authorized by building permits in March were at a seasonally adjusted annual rate of 1,458,000. This is 4.3 percent below the revised February rate of 1,523,000, but is 1.5 percent above the March 2023 rate of 1,437,000.
For March, personal income and outlays, released April 26, showed disposable personal income up 0.5 percent in current dollars and 0.2 percent in chained 2017 dollars. (“Chained dollars” is a measure of inflation that takes into account changes in consumer behavior in response to changes in prices.) Personal income in current dollars was also up 0.5 percent.
The February Personal Consumption Expenditures (PCE) price index from a year ago, excluding food and energy, released the same day, and reported to be the Federal Reserve’s preferred measure of inflation, printed at 2.8 percent. PCE inflation, also called “headline inflation,” printed at an annualized 2.7 percent.
The RCP/TIPP Economic Optimism Index (previously the IBD/TIPP Economic Optimism Index) for March was released March 6. (The April poll is not yet available.) In March, the index fell 1.6 percent, to 43.5. Optimism among investors gained 2.8 percent, from 49.3 in February to 50.7 in March, while it dropped by 2.9 percent among non-investors, from 41.3 in February to 40.1 in March.
_____________________________________
The views expressed, including the outcome of future events, are the opinions of this firm and its management only as of May 3, 2024, and will not be revised for events after this document was submitted to The Epoch Times editors for publication. Statements herein do not represent, and should not be considered to be, investment advice. You should not use this article for that purpose. This article includes forward-looking statements as to future events that may or may not develop as the writer opines. Before making any investment decision you should consult your own investment, business, legal, tax, and financial advisers. We associate with principals of Technometrica, co-publishers of the TIPP Economic Optimism Index, on survey work in some elements of our business.